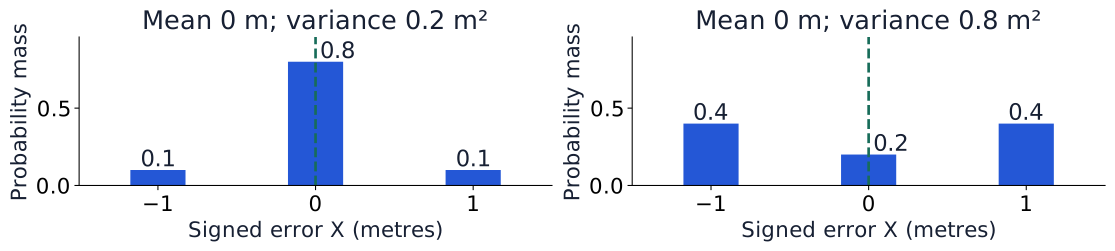
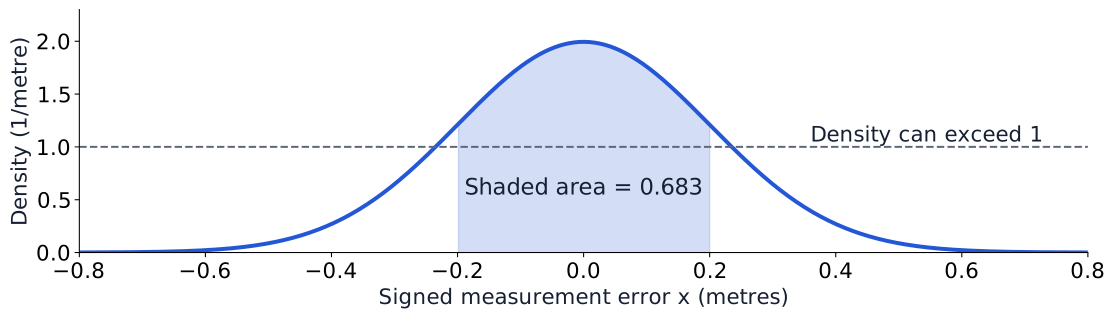
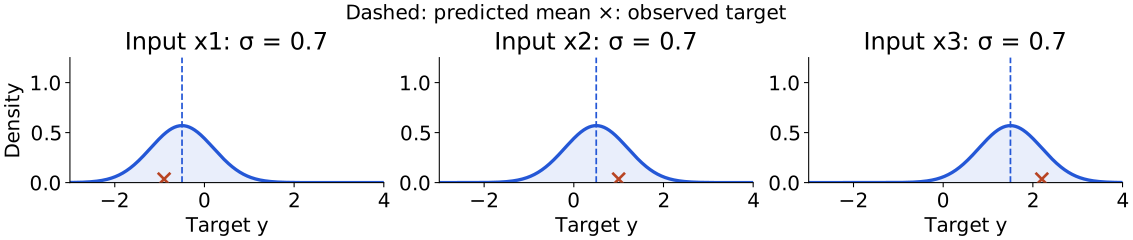
Identify the variable, what is observed, and which distribution supplies the average.
Natural logs and nats; reductions are stated explicitly. Specialized symbols and tensor shapes are defined beside first use. VAE paper translate to here.
Before probability: one scalar RNN
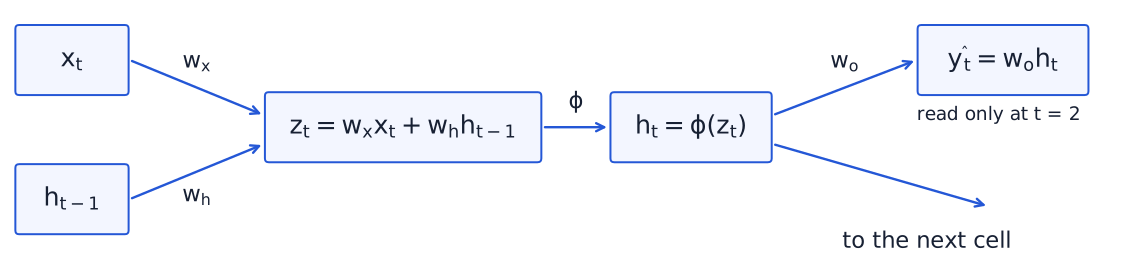
One input coordinate. One state coordinate. Three shared weights.
Trace a prediction forward, then follow its loss backward.
The state travels through time; the readout makes the prediction.
Both biases are fixed at zero. This example has one target and one final loss.
Forward: three cells, one final loss
Fixed ; shared ; any differentiable activation .
Cell 0
Cell 1
Cell 2
Save every and : the backward pass uses this same path.
Each cell receives its own and the previous state. Biases are fixed at zero; only the final state has a readout and loss.
Backward: follow the same path in reverse
— loss sensitivity to . Start at the prediction: .
Cell 0 ·
Cell 1 ·
Cell 2 ·
Through a weight: multiply by that weight. Through an activation: multiply by its local slope.
Keep weights fixed throughout the backward pass. Here denote the same sensitivities previously written . The initial state is fixed, not trained.
The deepest term contains every local derivative
What new factors appear when the recurrent path gets longer?
One recurrent weight and one activation slope per extra transition.
Chain rule for this final-loss scalar model. Color follows the same cells as the forward/backward diagrams; labels also identify each factor.
Shared parameters: add their contributions
The first contribution is zero. Does still affect ?
Yes: its path through remains; , which need not be zero.
Multiply along a path. Add across uses of the same parameter.
The indirect effects through earlier states are already included in . Do not count them again in the shared-weight sum.
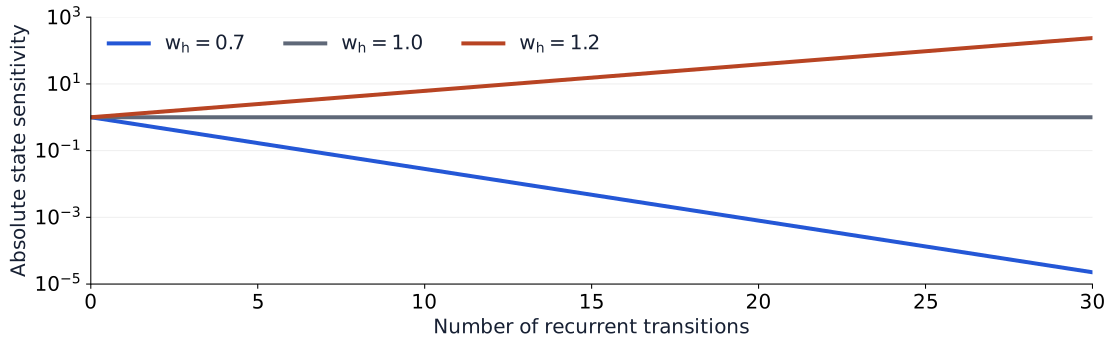
Longer paths multiply more derivatives
Vanishing: distant states barely influence the final state, weakening the learning signal.
Exploding: amplified sensitivities can produce very large gradients and unstable updates.
Plot: identity activation, so each factor is . Vertical axis is logarithmic. State sensitivity is not the total shared-weight gradient. Pascanu, Mikolov & Bengio (2013).
Changing the activation changes the backward path
Activation
Local derivative
Consequence on a path
Identity
Every factor is
Saturation suppresses factors
ReLU
for ; for
An inactive unit blocks that path
ReLU is not differentiable at zero; implementations choose a convention there.
A different activation does not guarantee long-range learning.
Gradient clipping limits a large update signal. It cannot recover a signal that has vanished along a path.
Values rounded for display; checked at full precision against autograd and finite differences. The half-squared-error loss uses the course symbol throughout this recap.
Part 1 · Probability describes the question
Probability
Likelihood
Bayesian inference
KL
VAE
Start with a joint table. Derive the rules. Extend them to continuous values.
Then ask what a distribution’s mean and spread tell us.
Reading route: Bishop, PRML, §1.2, then §§2.1–2.3. All examples and figures below are original course calculations.
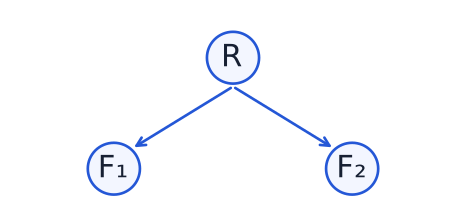
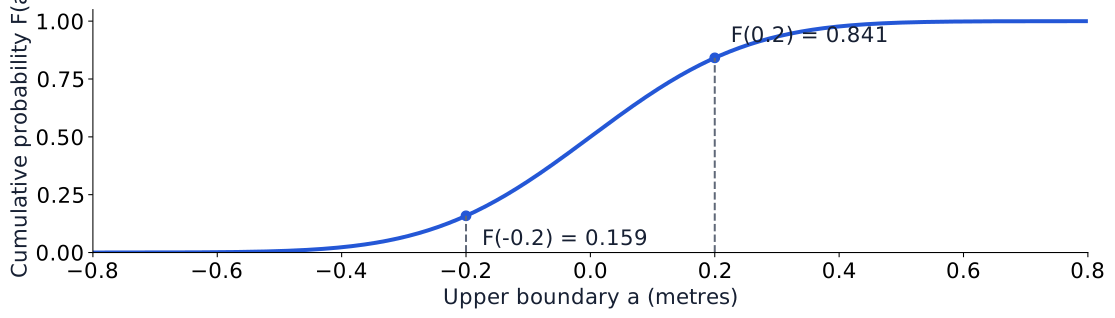
Synthetic teaching example. Real data need a rain threshold and signal definition. , ; disjoint events add. Bishop, PRML, §1.2.
A count table records both variables
100 synthetic outcomes. Here (rows) and (columns).
Row total
54
6
60
16
24
40
Column total
70
30
100
Cell count:
Column total: Row total:
Grand total:
Highlighted joint event:
Joint means that both conditions hold in the same observation.
: empirical proportions. Uniform sampling from this finite table gives these probabilities exactly. Population probabilities require a sampling model. Original editable table inspired by Bishop, PRML §1.2.
Conditioning changes the denominator
Keep the highlighted event and . Change the reference group.
Row total
54
6
60
16
24
40
Column total
70
30
100
Joint: both conditions, among all .
Marginal: any row, in column .
Conditional: row , among column .
: retain the signal column, then normalize.
For iid trials, as , empirical proportions converge to population probabilities (with positive conditioning probability). The probability rules themselves are exact identities. Bishop, PRML §1.2.
Sum and product rules follow from the counts
Write for . The same rules hold beyond this table.
Row total
54
6
60
16
24
40
Column total
70
30
100
Sum rule: gather every row in column .
Product rule: split the cell’s fraction.
Sum out a variable. Factor the joint by conditioning on a variable.
The count identity is exact for finite-table sampling, with . General probability identities: Bishop, PRML §1.2. Extra calculations and questions.
Bayes reverses the conditioning
The same joint event has two factorizations. Hold fixed.
Row total
54
6
60
16
24
40
Column total
70
30
100
Divide by and apply the sum rule to the evidence.
Require . The sum covers all disjoint, exhaustive categories. Joint symmetry exchanges variable order; conditional probabilities answer different questions. Bishop, PRML §1.2.
Steve: librarian or farmer?
Steve is reserved, helpful, orderly, and attentive to detail.
Which seems more likely: Steve is a librarian, or Steve is a farmer?
Imagine sampling him uniformly from a population containing only these two occupations. Commit to an intuition before seeing the counts.
What information is missing? The occupation proportions and how often the description occurs within each occupation.
Adapted from 3Blue1Brown’s original Steve problem. Open the original page for its visual explanation, or continue with the local worked example.
Steve: condition on the observed evidence
Teaching population: 10 librarians (40% shy), 200 farmers (10% shy). Use Shy as the simplified evidence category; Not shy is its complement.
Occupation
Shy
Not shy
Total
Librarian
4
6
10
Farmer
20
180
200
Total
24
186
210
Find , , , and .
, ; , .
Librarian probability rises from to ; farmer probability is still .
: mass of (discrete), or density at (continuous). Joint: describe together. Marginal: retain by summing/integrating out .
Rule
Discrete
Continuous
Normalize
Eliminate
Factor joint
Bayes
The denominator totals every possible explanation of the observed .
Condition where the marginal mass/density is positive. For densities, this defines conditioning even when a point has probability zero. General rules and practice. Bishop, PRML §§1.2–1.2.2.
Part 2 · A probability model explains the loss
Probability
Likelihood
Bayesian inference
KL
VAE
Choose a distribution for observations. Hold the observations fixed. Fit its parameters.
Supervised: hold inputs fixed Assume conditional independence:
Maximum likelihood estimation (MLE): maximize the conditional likelihood.
Loss recipe: support → model + assumptions → constrained outputs → NLL → sum/mean
Choose the observation model before choosing the loss.
. Natural-log loss is measured in nats. Mean NLL is ; omit only parameter-independent terms. selects maximizing/minimizing parameters. Bishop, PRML, Section 1.2.5.
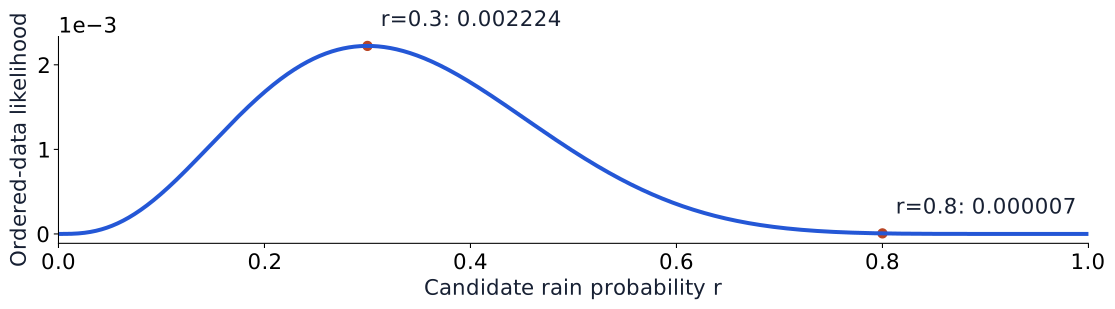
Synthetic ordered sequence : 3 rain, 7 dry. Assume independent, identically distributed (iid) Bernoulli observations with constant rain probability .
Each rain contributes ; each dry day contributes . Independence lets us multiply.
Fix the observations; vary . The peak at is the MLE.
Likelihood scores the fixed data, not posterior uncertainty over . Bishop, PRML, Section 1.2.3 and §2.1.
Fixed Gaussian noise explains MSE
Real-valued target → Gaussian model → mean output → negative log
Fixed common : the last two terms are constant in . Mean NLL , where .
MSE follows from a Gaussian model with fixed common observation variance.
Unequal fixed variances give weighted squared error. The RNN’s uses unit variance, omitting a constant. This noise assumption is not implied by the CLT. Bishop, PRML §1.2.5.
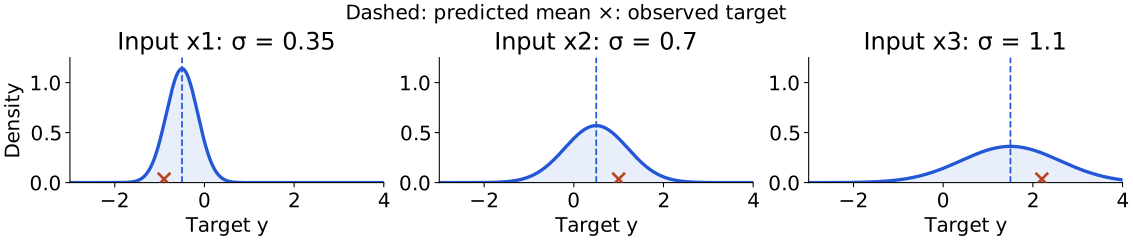
Input-dependent Gaussian noise
Real-valued target → Gaussian model → mean and log-variance outputs
Increasing variance reduces the residual term; the log-variance term penalizes that inflation. Both outputs are fitted.
gives positive variance . Heteroscedastic means input-dependent noise. With an exactly zero residual, unrestricted variance can collapse; constraints may be needed. Bishop, PRML §1.2.5.
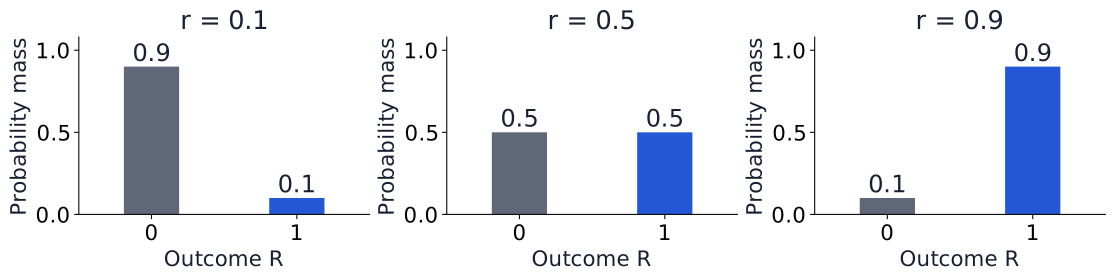
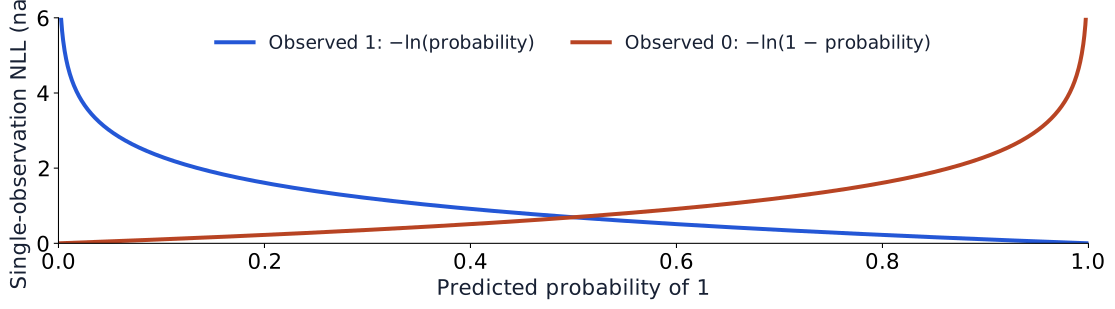
Bernoulli observations explain BCE
Binary target → Bernoulli → logit →
Both outcomes contribute through the same Bernoulli formula.
For the rain sequence: . Compute on logits for stability: PyTorch BCEWithLogitsLoss. Bishop, PRML §2.1.
Categorical observations explain multiclass CE
One class among → categorical → logits →
One-hot target , ; class probabilities .
Observed class: cat. Predicted probabilities: cat 0.7, dog 0.2, bird 0.1. Which probabilities enter the loss?
Only the observed class: nats. Multiple simultaneous binary labels instead need a Bernoulli model for each label.
The one-hot product describes one categorical draw; it does not assume independent classes. Use logits: PyTorch CrossEntropyLoss. Bishop, PRML §2.2.
The output head and observation model must agree
Observation model
Network output
Negative log likelihood
Gaussian, fixed common variance
Mean
Scaled squared error + constant
Gaussian, learned variance
Mean and log variance
Weighted residual + log-scale term
Bernoulli
One logit; sigmoid probability
BCE
Categorical
logits; softmax probabilities
Multiclass CE
Choose a model: temperature, rain/no rain, one handwritten digit class.
Temperature: Gaussian as an explicit assumption. Rain/no rain: Bernoulli. One digit class: categorical.
A Gaussian assumption needs justification for the data. Sum or mean per-observation NLL consistently; regularization scaling matters later. Bishop, PRML §§1.2.5, 2.1–2.2.
Part 3 · Update uncertainty with evidence
Probability
Likelihood
Bayesian inference
KL
VAE
A prior describes uncertainty before these observations. A posterior incorporates the observations. Prediction carries the remaining uncertainty forward.
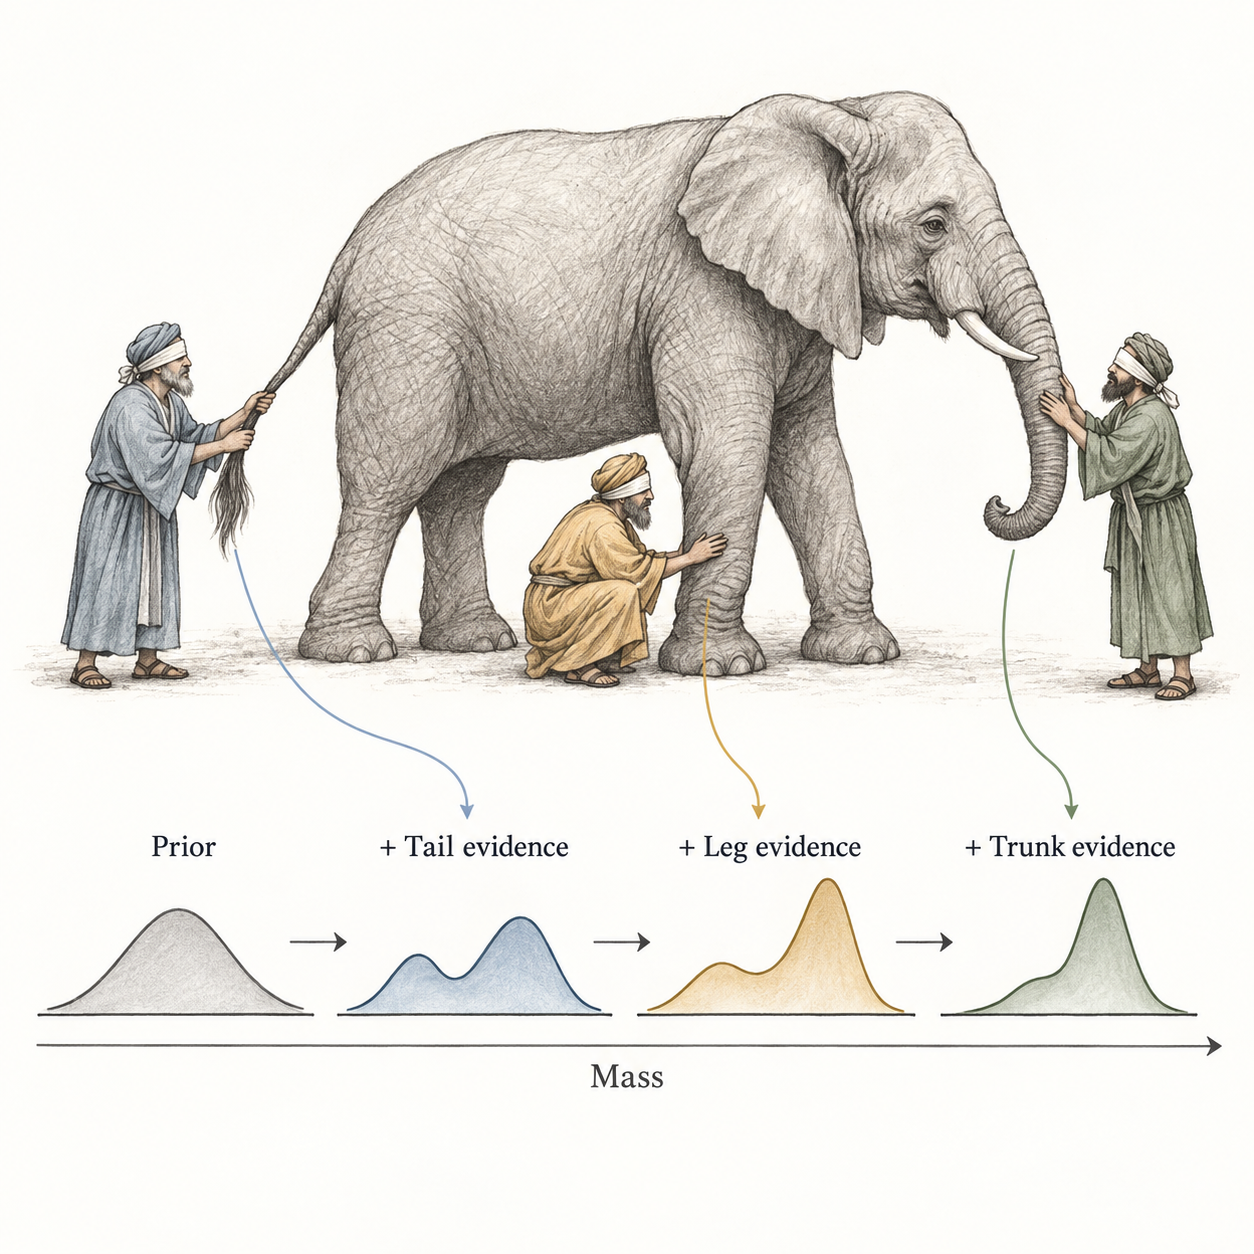
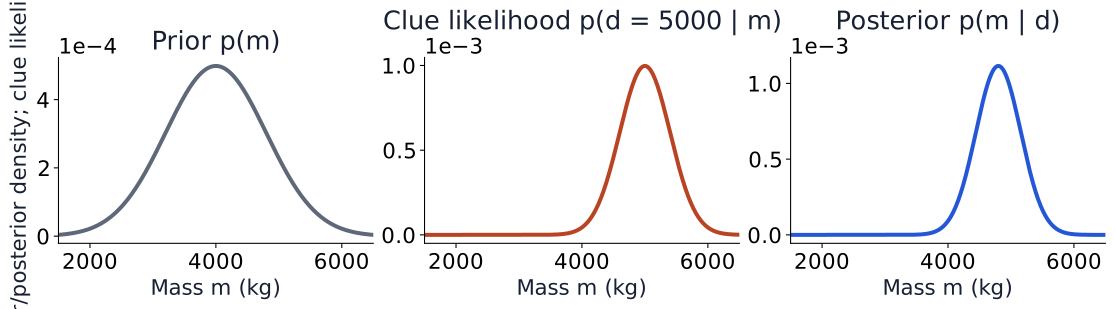
The elephant: a prior meets a noisy clue
Unknown mass kg. Hypothetical report kg; observation model .
Multiply likelihood by prior, then normalize: here approximately.
Hypothetical teaching values; exact posterior variance is 128000 kg². now denotes unknown model parameters; evidence integrates over them. The same rule updates a mass or network weights. Bishop, PRML §§1.2.3, 2.3.6.
The elephant: update one clue at a time
: unknown mass. : tail, leg, trunk clues.
Start: .
Tail:
Leg:
Trunk:
Normalize each curve to area one. This posterior becomes the next prior.
means “proportional to”: normalization is omitted. Instructor-supplied conceptual illustration, not computed posteriors. Bishop, PRML, Section 1.2.3.
MLE, MAP, and a full posterior
Result
Operation
What do we keep?
MLE — maximum likelihood estimation
Maximize
One parameter setting at the likelihood peak
MAP — maximum a posteriori estimation
Maximize
One parameter setting at the posterior-density peak (mode)
Full posterior
Normalize
Entire distribution: spread and possible multiple modes
Does a MAP neural network retain uncertainty over its weights?
It keeps one setting. The full posterior retains how uncertainty is distributed.
An estimate locates a peak; a distribution also describes the remaining spread.
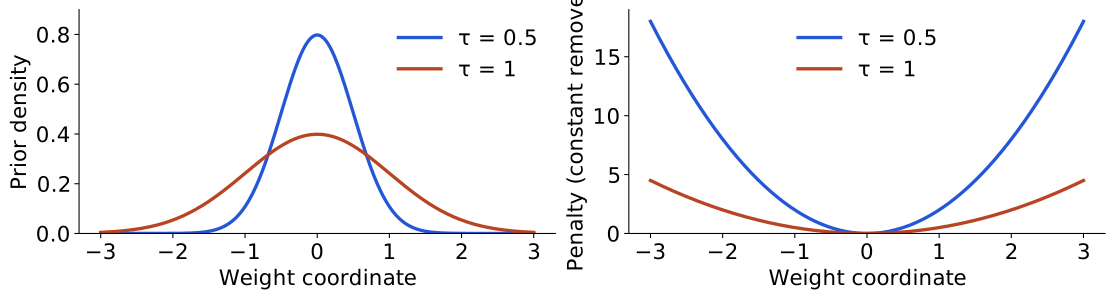
: weight-prior scale; : observation-noise scale. The next slide combines this penalty with NLL through MAP. Bishop, PRML, Section 1.2.6.
MAP produces L2 regularization
Extend the loss recipe: observation NLL + negative log prior → MAP
Written objective
Coefficient giving this MAP fit
Mean NLL
MSE
The L2 coefficient depends on the loss scale and reduction.
Drop evidence, which is constant in . MSE row assumes fixed common Gaussian variance , with no factor ½ in MSE. MAP is point estimation; decoupled optimizer weight decay is not generally this objective. Bishop, PRML §1.2.6.
Prediction after fitting
One fitted parameter setting
Evaluate one model at the new input.
Posterior predictive
Average predictions over parameter uncertainty.
Does a stronger L2 penalty guarantee better validation predictions?
No. It changes the tradeoff with data fit; validation performance depends on the model and data.
L2 supplies a MAP objective; it does not perform posterior averaging.
denote a future input and target. Rainfall prediction. Bishop, PRML §§1.2.3, 2.1.1.
Frequentist and Bayesian approaches to ML
Question
Frequentist approach
Bayesian approach
Unknown parameters
Fixed but unknown
Uncertainty represented by prior/posterior
Use of evidence
Sampling model; MLE is one example
Likelihood × prior, then normalize
Report uncertainty
Repeated-sampling properties of procedures
Posterior and posterior predictive distributions
Prediction here
Evaluate a fitted model
Average over posterior; MAP retains one mode
Modern AI connection
Neural regression/classification; next-token NLL
Bayesian neural networks; approximate latent inference in VAEs
Both quantify uncertainty. NLL is shared machinery.
Score the same outcomes with two distributions. KL measures the average extra log loss relative to a reference.
Bishop, PRML, §§1.6–1.6.1. Natural logarithms and nats throughout this lecture.
KL measures average extra log loss
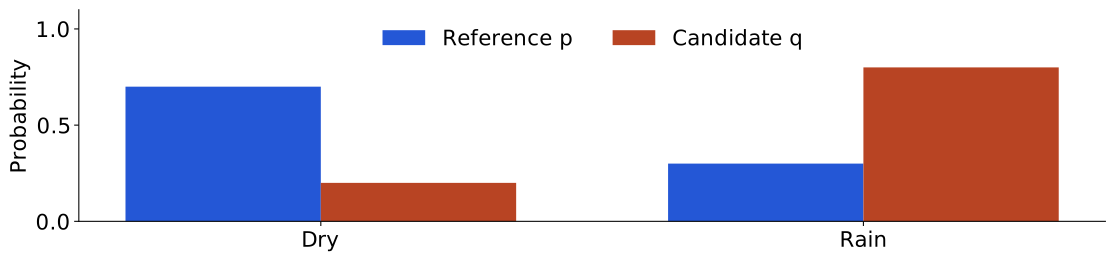
Dry/rain reference frequencies: . Candidate predictions: . Average outcomes using .
For outcome , score with : ; reference score: . Extra log loss: .
The first argument supplies the averaging weights.
: dry or rain. Nats: units of log loss using natural logs. Here is empirical, not a known population law. Bishop, PRML, Section 1.6.1.
KL has a direction
Expression
Average under
Value
0.583 nats
0.534 nats
0
KL is nonnegative; individual summands can be negative. If but , the forward KL is infinite.
For densities: .
KL is a divergence, not a distance metric.
Zero means agreement almost everywhere; appropriate support and finite terms are assumed. KL is asymmetric and need not satisfy the triangle inequality. Bishop, PRML §1.6.1.
Part 5 · Infer and generate with a VAE
Probability
Likelihood
Bayesian inference
KL
VAE
A latent code is a small vector of hidden coordinates. First specify how this code can generate an observation. Then ask which codes could explain an observed image. Approximate that inverse problem with a trainable distribution.
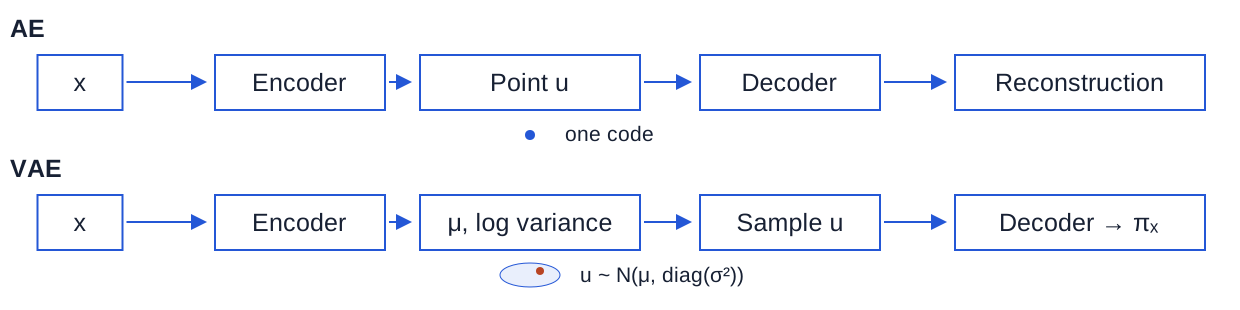
AE: encoder returns a point. Reconstruction alone does not specify a prior for generating new codes.
VAE: encoder returns Gaussian parameters. The generative model also specifies and .
The VAE learns an approximate distribution of plausible codes for each image.
: image; : latent coordinate vector; : decoder weights; : encoder weights. Paper become course ; course remains an activation. Kingma & Welling, §§2–3.
Generation and inference
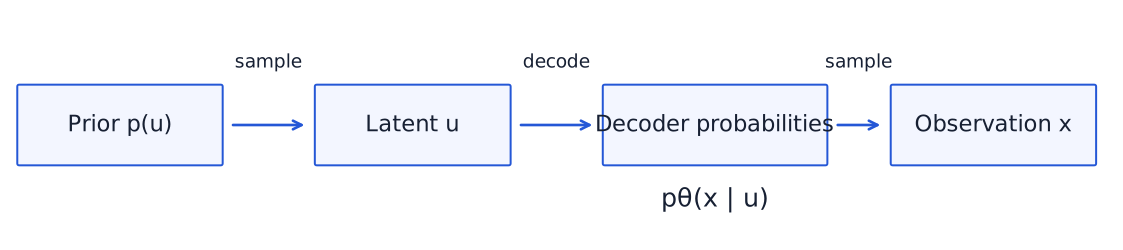
Generate: , then .
Infer: given , find plausible using .
The encoder approximates inference; the prior and decoder define generation.
Network weights are point estimates here. Per-image latent uncertainty is not a Bayesian posterior over those weights. Kingma & Welling, §2.1.
Bayes for a two-pixel image
Prior ; pixels are independent given the code.
Code
0.8
0.2
0.3
0.7
Same Bayes rule as Steve: replace occupations with candidate codes.
Exact discrete teaching model, not a continuous VAE or a trained encoder. All four images normalize under each code. Check exact ELBO arithmetic.
The posterior needs an evidence integral
For continuous codes, use a spherical standard-normal prior: independent , written . Covariance averages the product of two variables’ deviations from their means. is the identity covariance: unit variance in each coordinate and zero covariance between them.
At one code
The decoder can evaluate .
Across all codes
Many codes can explain one image. A nonlinear decoder can make this integral impractical.
Evidence averages over all possible codes, not just one decoder evaluation.
Spherical means equal spread in every direction. is a dummy integration variable. Continuous variables alone do not imply intractability; model structure matters. Kingma & Welling, §2.1; Bishop, PRML §10.1.
The encoder proposes an approximate posterior
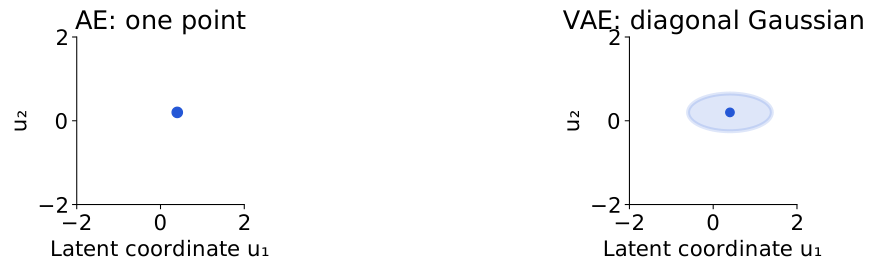
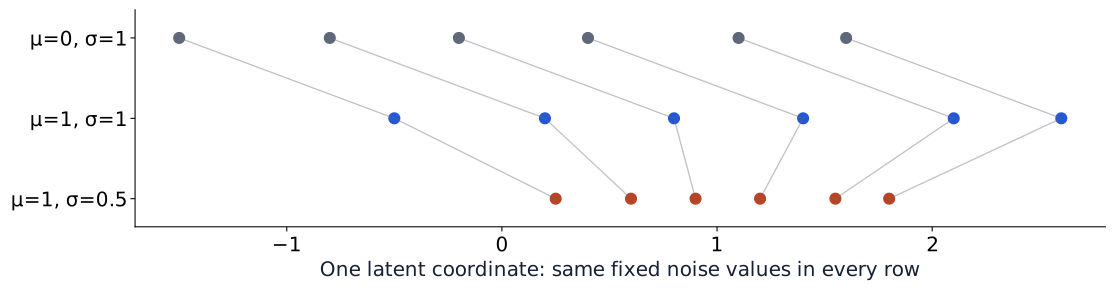
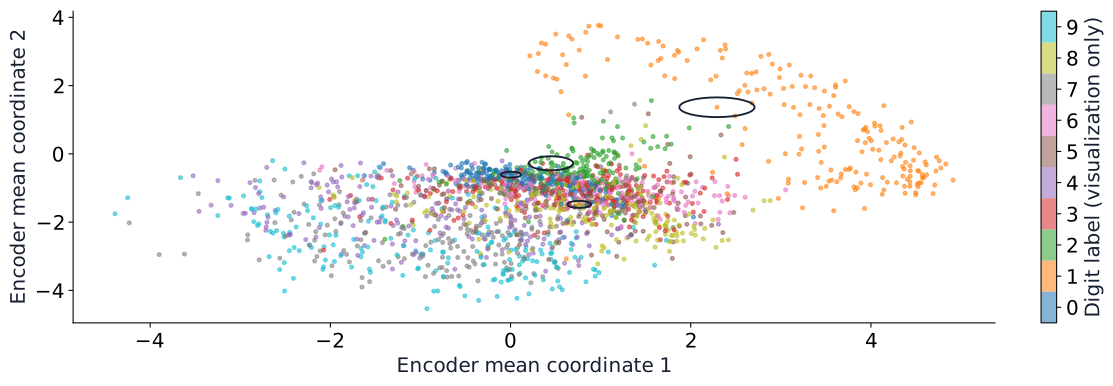
Given , the encoder predicts centre and spreads . Under , the two coordinates are independent:
Different coordinate spreads → an axis-aligned ellipse; equal spreads → a circle.
: coordinate variances on the diagonal; zeros elsewhere.
We need a training objective even when the exact latent posterior is hard to compute. is the encoder’s approximation; averages over its possible codes.
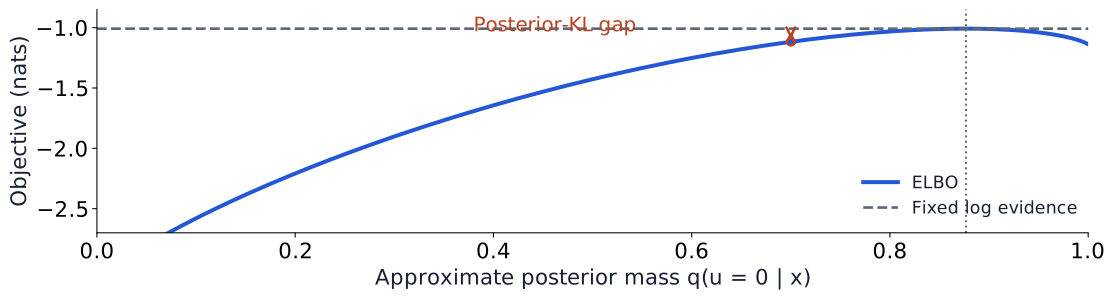
Bayes and the definition of KL give a usable expression:
Log evidence : how well the generative model explains after averaging over the prior.
Posterior gap: how far the encoder’s is from the exact posterior.
Write the distribution, identify what is observed, and trace what is inferred or optimized.
Rainfall inference estimates a shared event probability. This VAE infers a per-image code and optimizes shared network weights. Compare frequentist and Bayesian approaches.
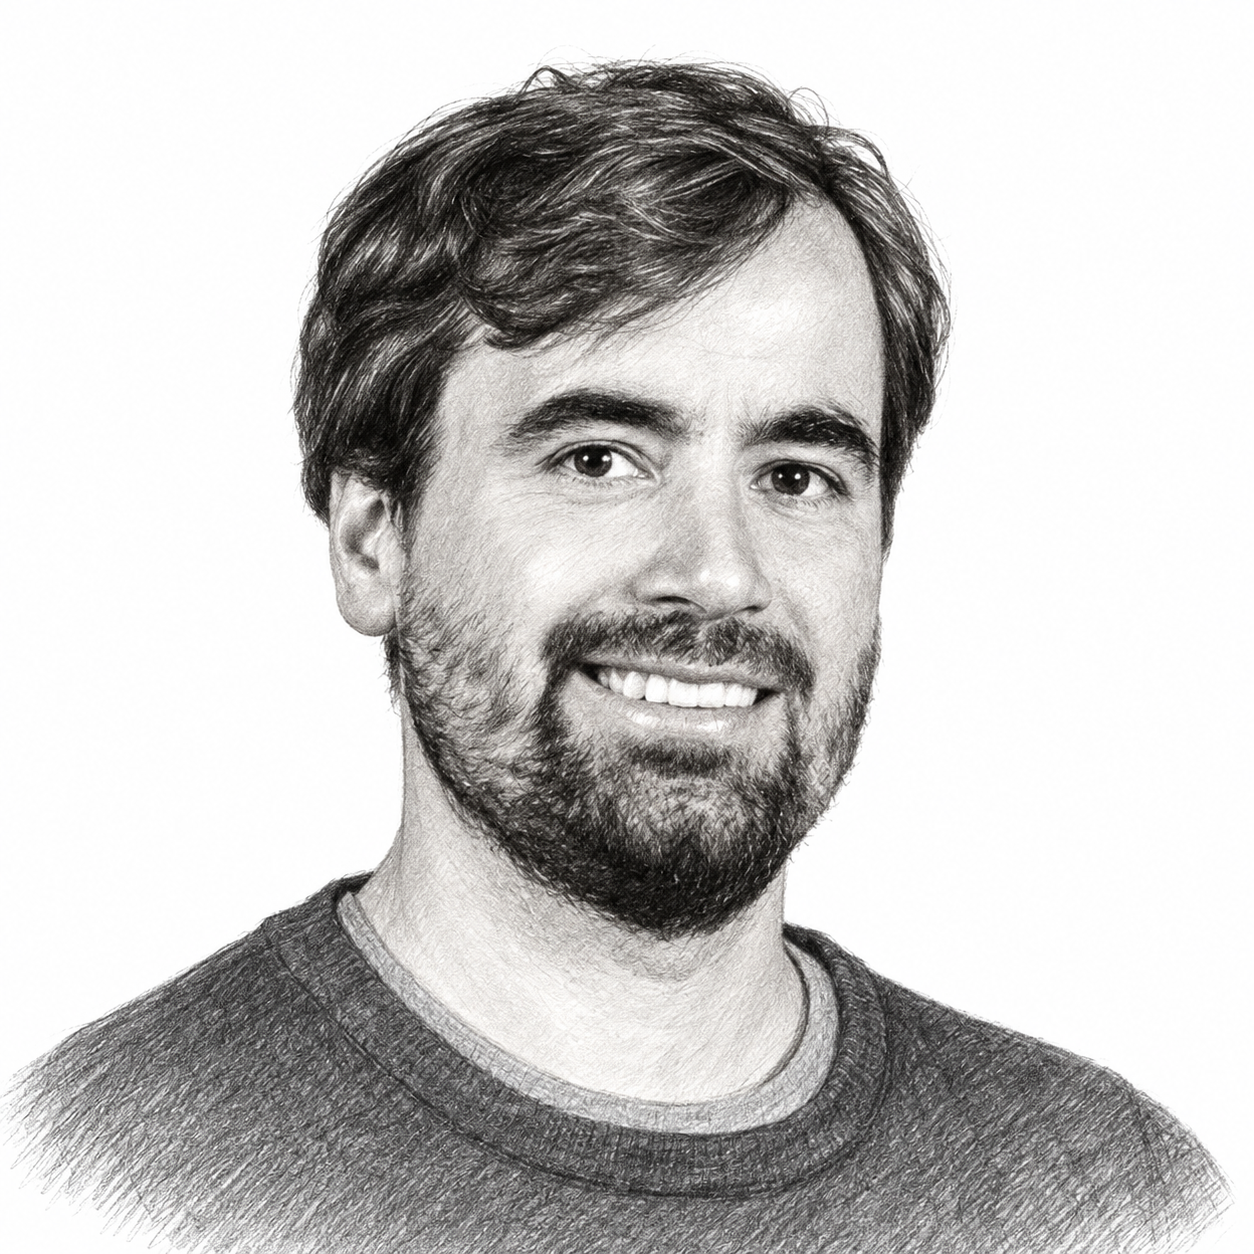
Person of the day: Diederik P. Kingma
Diederik P. (Durk) Kingma
Coauthored Auto-Encoding Variational Bayes with Max Welling (2013 preprint).
Coauthored Adam with Jimmy Ba (2014 preprint).
PhD, University of Amsterdam, 2017, advised by Welling.
A learned inference network and a differentiable sampling path connect today’s probability model to neural-network training.
Kingma’s site · AEVB · Adam. Biography verified 2026-10-14. Portrait supplied by the instructor.
Tutorial: predict, compute, and interpret
Rainfall
Same observations: likelihood → MLE → prior/posterior → prediction. Explain which object describes data and which describes uncertainty about .
VAE
Identify inferred codes and fitted weights. Explain reconstruction, latent maps, generation, and the sampling gradient path.
Kingma & Welling, Auto-Encoding Variational Bayes (2013 preprint; ICLR 2014). §§2–3 and Appendices B/C: variational bound, reparameterization, Gaussian KL and observation models. Course notation translates paper to , and paper ELBO to course .
Torchvision MNIST. Dataset loading and train/test split. Pilot uses installed Torchvision 0.23.0 and PyTorch 2.8.0.
Elephant graphical abstract supplied by the instructor. RNN diagrams redraw the Week 06 model; diagrams and sensitivity plots are original course figures.
Optional depth begins here
The main lecture is complete. Use the following slides for practice or selected live derivations.
Only KL changes. Minimizing empirical categorical cross-entropy minimizes . One-hot CE is .
is the fixed reference term. This exact finite discrete identity does not identify a continuous empirical measure with a density. Detailed information theory is deferred to later in the course. Bishop, PRML §1.6.1.
RNN practice: the full backward ledger
Same tanh example: , .
Backward order
−0.412
0.964
−0.397
−0.318
0.696
−0.221
−0.177
0.786
−0.139
Use these sensitivities to calculate all three parameter gradients.
Are rain and signal independent in our table? Can two mutually exclusive events with positive probability be independent?
Rain and signal: , whereas . Independence fails.
Mutually exclusive events: their intersection has probability zero. If both have positive probability, their product is positive, so independence fails here too.
Independence means factorization. Mutual exclusivity means no shared outcomes.
One failed factorization disproves independence; checking one successful cell does not establish it in general. Bishop, PRML §1.2. Practice menu · Return to the rules.
Practice: independence after conditioning
A separate hypothetical sensor model
Each sensor has , ; let .
Does conditional independence imply marginal independence? Compare with .
No. Mixing groups with different signal rates induces marginal dependence in this model.
Factorization is a model assumption, not a conclusion from the first rain/signal table or a causal claim. Bishop, PRML §8.2. Practice menu · Return to Bayes.
Optional practice: distributions and moments
Explore the longer calculations. Each fixed question has a worked answer revealed by a click.
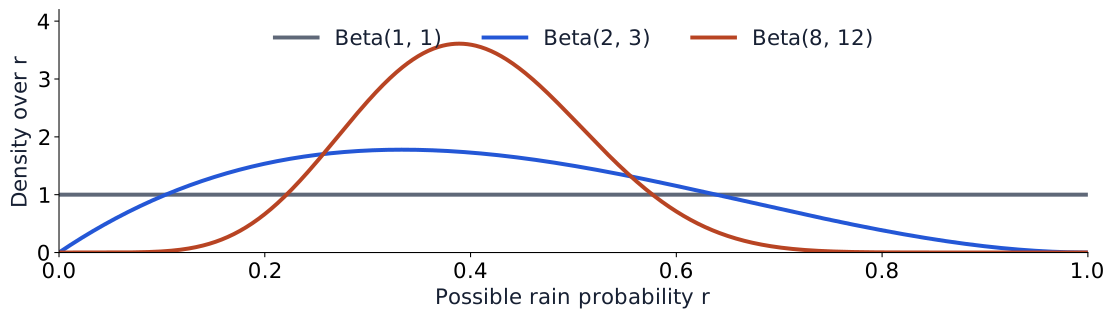
Beta: a density over a possible probability parameter
Do these curves describe a binary observation, or uncertainty over its probability ?
Uncertainty over . The common mean is for Beta(2,3) and Beta(8,12); their variances are and about .
normalizes the density. These are example models, not successive updates. Bishop, PRML §2.1.1. Practice menu · Return to Bernoulli.
Covariance describes how two variables vary together
The rain/signal table
Correlation divides by both standard deviations:
Does zero covariance guarantee independence?
No. Let be uniform on and .
−1
0
1
1
0
1
, so . Yet is determined by and is not constant.
Finite second moments assumed. Correlation requires positive variances; independence implies zero covariance, but its converse fails in general. Bishop, PRML §1.2.2. Practice menu · Return to moments.
Gaussian: location and scale for continuous values
Which parameter shifts the curve? Which parameter changes its width?
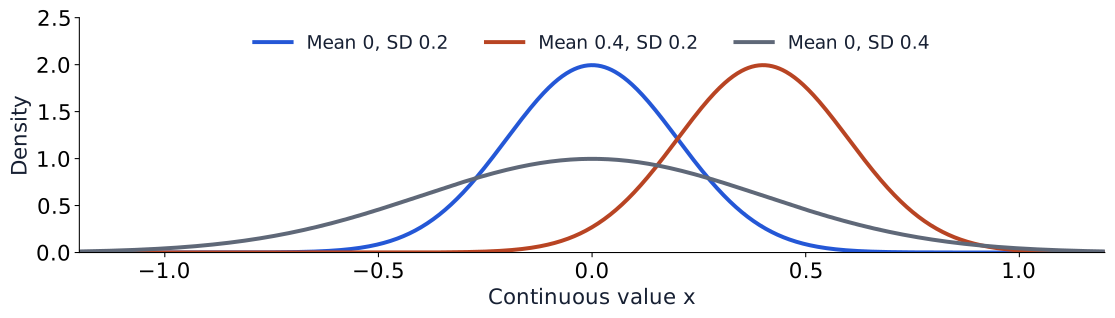
sets location; sets spread. has mean and variance . All these densities have unit area.
Write , with . Shading marks the variables eliminated.
Marginalize the joint over every remaining coordinate
(discrete)
(continuous)
Chain rule: factor the joint in a chosen order
Does this factorization require independence?
No. The chain rule holds without independence; that extra assumption can simplify the conditionals.
Sum/integrate over each eliminated variable’s support. Mixed models combine sums and integrals. For , the empty product is one. Bishop, PRML §§1.2, 8.2. Practice menu · Return to the rules.
Worked answer: input-dependent Gaussian loss
Start with the scalar Gaussian negative log density:
Substitute : and .
Writing , . For fixed nonzero residual, the optimum is . Without , arbitrarily large variance drives the residual term toward zero.
The constant can be omitted; the fitted log-variance term cannot.
If , drives this unrestricted NLL down without bound. This is observation noise, not a posterior over weights. Return to the question. Bishop, PRML §1.2.5.
Rainfall: the Beta prior gives an exact update
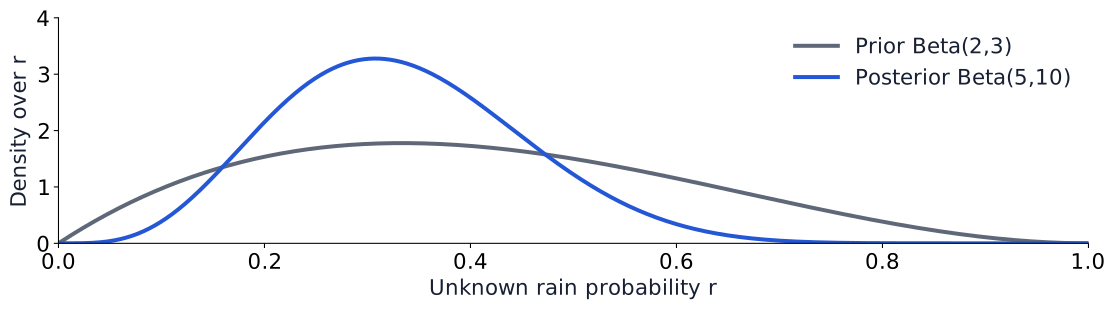
Beta(2,3) + 3 rain + 7 dry → Beta(5,10).
Conjugacy: the posterior remains in the prior’s distribution family. Constant , common Bernoulli model, conditionally independent observations. Real weather may violate these assumptions. Bishop, PRML §2.1.1. Practice menu.
Same prior mean, different resistance to evidence
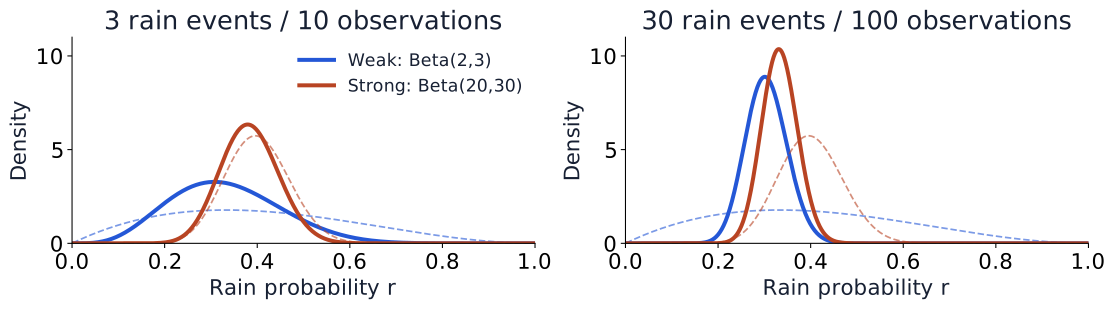
Change only : which posterior mean moves further toward ?
The weak prior moves farther: posterior mean 0.333 versus 0.383 after 3 of 10 rain observations.
Dashed = prior; solid = posterior. Synthetic datasets: and . Fixed prior influence decreases in this model as grows. in the displayed weighted-average identity. Bishop, PRML §2.1.1. Practice menu.
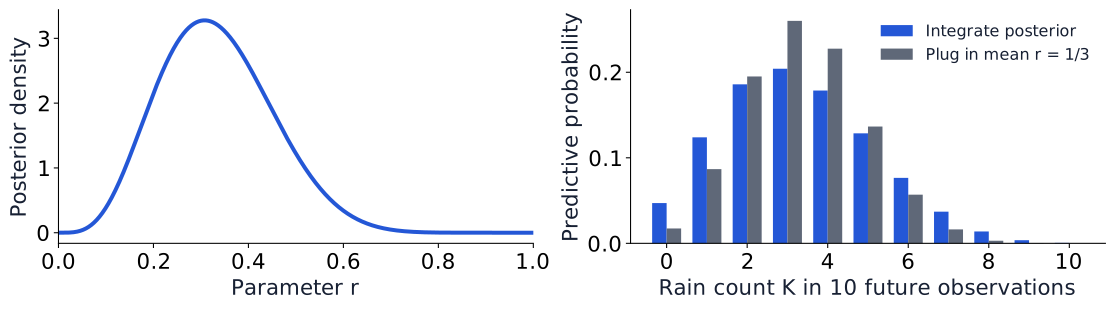
A posterior density is not a forecast of rain counts
Let count rain events in future observations. Given , use ; retain the same model assumptions.
Same mean count, different spread: integrating uncertainty changes the prediction.
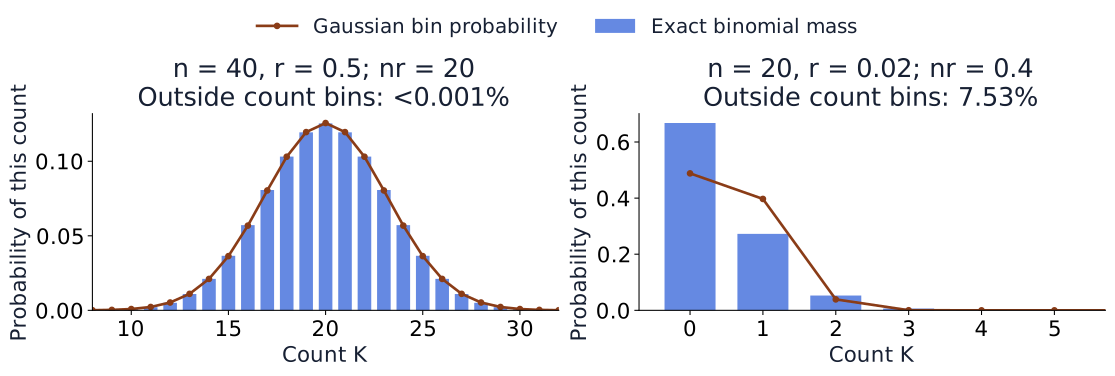
Beta-binomial variance ; plug-in Binomial variance . Axes represent different variables and units. A credible interval for is not a prediction interval for . Original calculation from the predictive integral; Bishop, PRML §2.1.1. Practice menu.
ELBO algebra from Bayes
For , insert Bayes into the definition of KL:
Evidence does not depend on the code, so it leaves the expectation. Rearrange: .
Appropriate support and finite expectations assumed. Return to ELBO. Kingma & Welling, §2.2.
Gaussian KL: take the expectation
For independent coordinates of , :
Use and :
Each coordinate’s contribution is zero at , .
This is KL to the prior, not to the model posterior. Return to image loss. Kingma & Welling, Appendix B.
Check the signs with the exact toy
For and :
Quantity
Calculation
Nats
Reconstruction log likelihood
−1.03
Prior KL
0.0823
ELBO
Reconstruction log likelihood − prior KL
−1.12
Posterior gap
0.109
ELBO is maximized; its negative is minimized. Keep the sign of the prior term.
Numbers rounded for display; identities checked at full precision by the figure generator. The gap is checkable because this posterior is exact. Return to the bound.
What produced the figures we are about to inspect?
Fixed choice
Pilot setting
Data
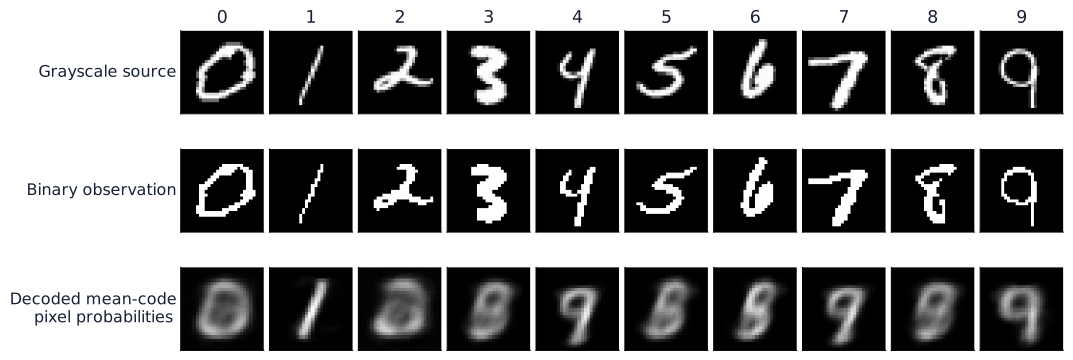
12,000 training + 2,000 disjoint validation images from MNIST’s training split
Observation
Pixel/255 ; all ten digit classes retained
Optimization
15 epochs, batch 256, Adam learning rate 0.001; 705 updates/model
Comparison
; common initialization, batch order and noise streams
Validation
Same images and four common code draws/image; report NLL and KL separately
These are measured outputs of one controlled, finite-budget pilot.
CPU, one initialization seed; official test set unused. Labels only select a fixed gallery and color the latent map. This is not a convergence, robustness, or Colab-runtime claim. Full settings and metrics: pilot record. Practice menu.
One sampled code per image in training; exact latent KL. Separately averaging pixels and latent coordinates would change their relative weight. Gaussian sampling and reduction checks are reproducible in the pilot generator. Practice menu.
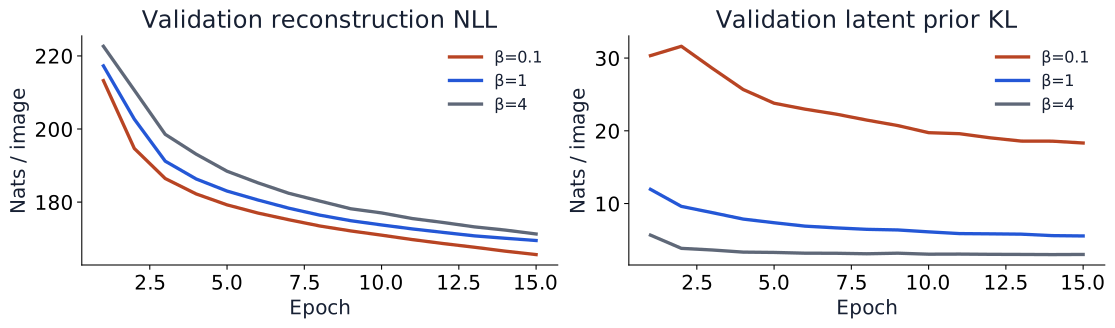
This pilot measured two competing pressures
In this run, larger reduced latent KL and increased reconstruction NLL.
Same validation examples and sampled noise, separate unweighted terms. Do not compare differently weighted total losses as a common quality metric. One seed and 705 updates per model; these observations are not a universal ordering. Original pilot. Practice menu.
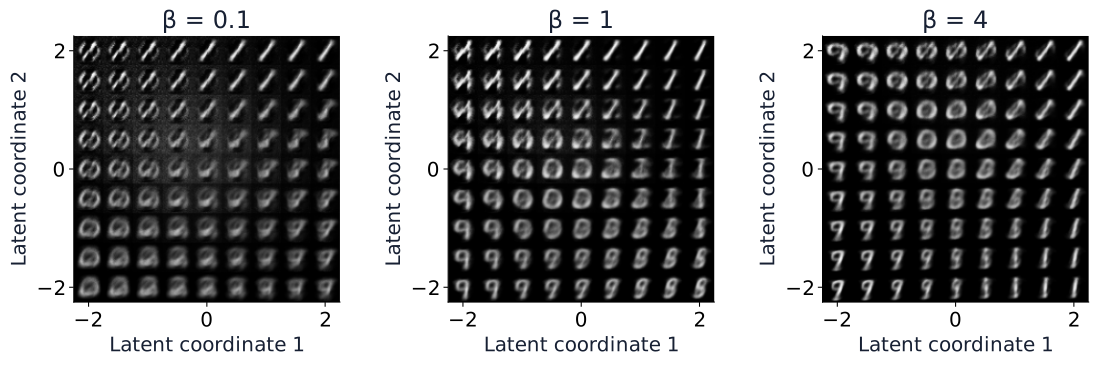
Compare the same latent region across models
Open discussion: compare recognizable and ambiguous regions. Expect differences in coverage; this grid alone cannot establish generation quality.
Chosen coordinates in , not random prior samples. Every tile is a probability image. Inspect these alongside reconstruction NLL, latent KL, and actual prior draws; a grid alone does not establish generative quality. Practice menu.
Naive Bayes: two binary features
Toy classes ; stipulated model probabilities, not estimates from counts.
Class
Prior
0.4
0.8
0.7
0.6
0.2
0.3
Observe both features equal 1. Find . What permits the product?
Assume : scores are and . Normalize: .
Redundant features can count the same evidence twice and distort confidence. Count-based estimation needs an explicit smoothing choice for unseen combinations. Bishop, PRML §8.2. All practice · Return to Bayes.
Observation noise and parameter uncertainty
Method
What varies?
Prediction
Heteroscedastic head
Noise scale depends on input
Observation distribution at fitted weights
Bayesian regression
Weights have a posterior
Average over weights and observation noise
MC dropout
Stochastic network masks
Approximate predictive draws under assumptions
For a specified posterior predictive model: Observation spread and uncertainty in the predicted mean can coexist.