# @title Auxiliary: training-progress visualisation
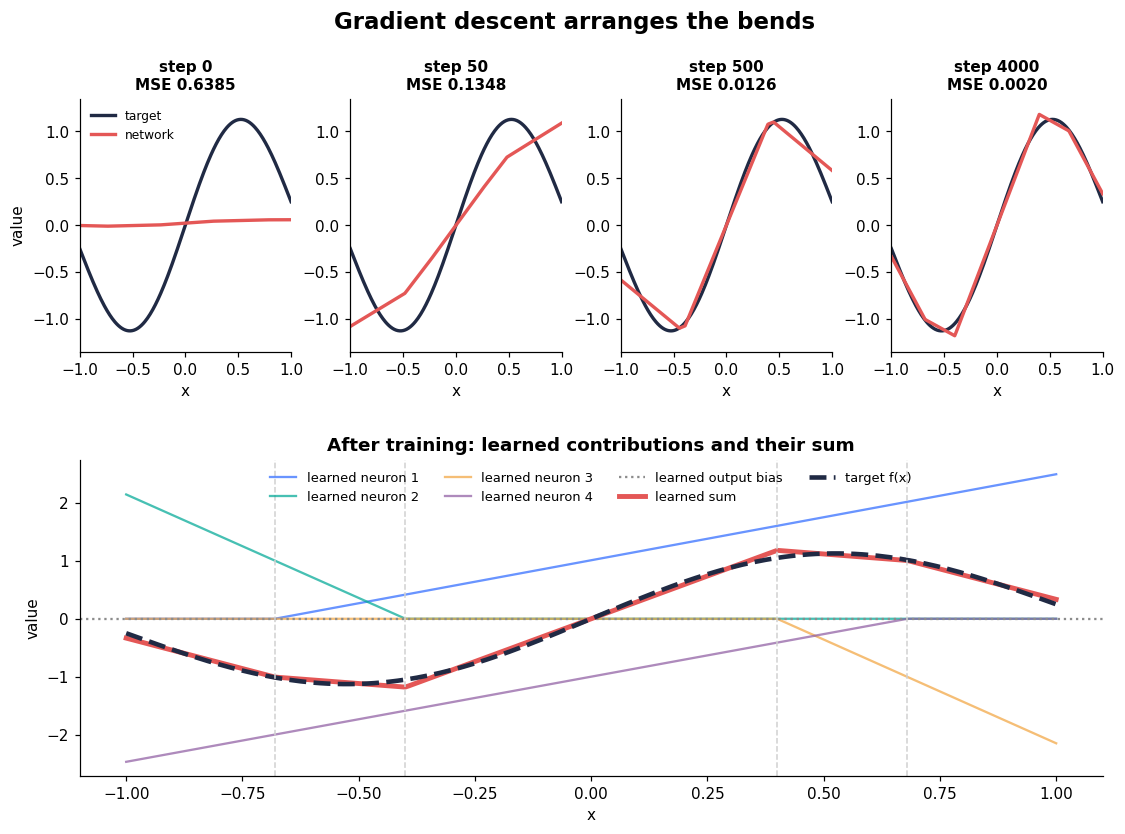
def plot_training_story(x, target, snapshots, epochs, components, total, output_bias, breakpoints):
    fig = plt.figure(figsize=(12.0, 8.0))
    grid = fig.add_gridspec(2, 4, height_ratios=[1.0, 1.25], hspace=0.38, wspace=0.28)
    for column, epoch in enumerate(epochs):
        ax = fig.add_subplot(grid[0, column])
        frame = snapshots[epoch]
        ax.plot(x[:, 0], target[:, 0], color=TARGET_COLOR, lw=2.2, label="target")
        ax.plot(x[:, 0], frame["prediction"][:, 0], color=MODEL_COLOR, lw=2.2, label="network")
        ax.set_title(f"step {epoch}\nMSE {frame['loss']:.4f}", fontsize=10)
        ax.set(xlim=(-1, 1), ylim=(-1.35, 1.35), xlabel="x")
        if column == 0:
            ax.set_ylabel("value"); ax.legend(frameon=False, fontsize=8)
    ax = fig.add_subplot(grid[1, :])
    for j in range(components.shape[1]):
        ax.plot(x[:, 0], components[:, j], color=HINGE_COLORS[j], lw=1.5, alpha=0.72, label=f"learned neuron {j + 1}")
    ax.axhline(float(output_bias), color="0.55", ls=":", lw=1.5, label="learned output bias")
    ax.plot(x[:, 0], total[:, 0], color=MODEL_COLOR, lw=3.2, label="learned sum")
    ax.plot(x[:, 0], target[:, 0], color=TARGET_COLOR, lw=3.0, ls="--", label="target f(x)")
    for point in breakpoints:
        if -1 <= point <= 1:
            ax.axvline(float(point), color="0.82", ls="--", lw=1)
    ax.set(xlabel="x", ylabel="value", title="After training: learned contributions and their sum")
    ax.legend(frameon=False, ncol=4, fontsize=8.5, loc="upper center")
    fig.suptitle("Gradient descent arranges the bends", fontsize=15, fontweight="bold")
    finish_figure(fig, "04-gradient-descent-arranges-the-bends")

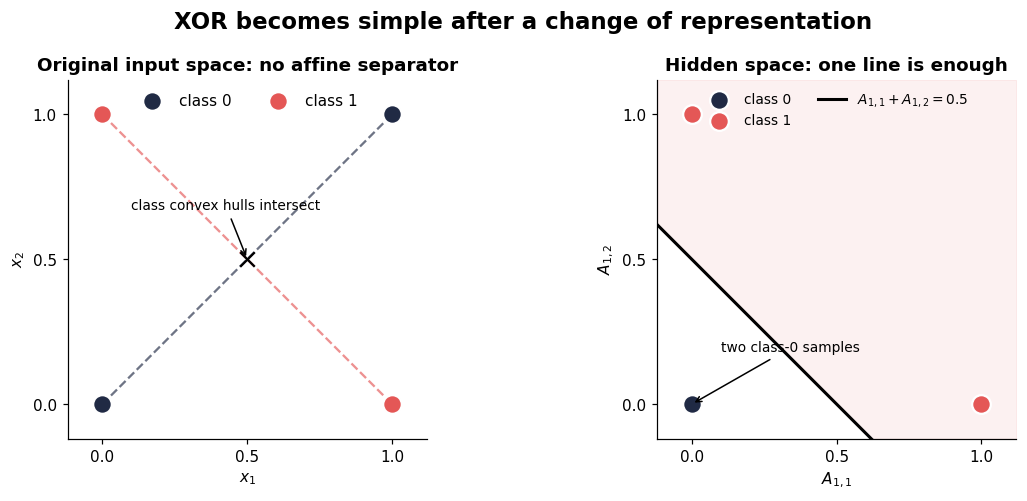
def plot_xor_wall(X, y, A1):
    fig, axes = plt.subplots(1, 2, figsize=(11.0, 4.6))
    class_colors = [TARGET_COLOR, MODEL_COLOR]
    for label in (0, 1):
        mask = y == label
        axes[0].scatter(X[mask, 0], X[mask, 1], s=150, color=class_colors[label],
                        edgecolor="white", linewidth=1.5, label=f"class {label}", zorder=3)
    axes[0].plot([0, 1], [0, 1], color=class_colors[0], ls="--", alpha=0.65)
    axes[0].plot([0, 1], [1, 0], color=class_colors[1], ls="--", alpha=0.65)
    axes[0].scatter([0.5], [0.5], marker="x", s=90, color="black", zorder=4)
    axes[0].annotate("class convex hulls intersect", (0.5, 0.5), (0.10, 0.67),
                     arrowprops={"arrowstyle": "->"}, fontsize=9)
    axes[0].set(title="Original input space: no affine separator", xlabel="$x_1$", ylabel="$x_2$")
    axes[0].legend(frameon=False, loc="upper center", ncol=2)

    grid = np.linspace(-0.12, 1.12, 200)
    boundary = 0.5 - grid
    axes[1].fill_between(grid, np.clip(boundary, -0.12, 1.12), 1.12,
                         color=MODEL_COLOR, alpha=0.08)
    for label in (0, 1):
        mask = y == label
        axes[1].scatter(A1[mask, 0], A1[mask, 1], s=150, color=class_colors[label],
                        edgecolor="white", linewidth=1.5, label=f"class {label}", zorder=3)
    axes[1].plot(grid, boundary, color="black", lw=2, label="$A_{1,1}+A_{1,2}=0.5$")
    axes[1].annotate("two class-0 samples", (0, 0), (0.10, 0.18),
                     arrowprops={"arrowstyle": "->"}, fontsize=9)
    axes[1].set(title="Hidden space: one line is enough", xlabel="$A_{1,1}$", ylabel="$A_{1,2}$")
    axes[1].legend(frameon=False, loc="upper center", ncol=2, fontsize=9)
    for ax in axes:
        ax.set(xlim=(-0.12, 1.12), ylim=(-0.12, 1.12), aspect="equal", xticks=[0, 0.5, 1], yticks=[0, 0.5, 1])
    fig.suptitle("XOR becomes simple after a change of representation", fontsize=15, fontweight="bold")
    fig.tight_layout()
    finish_figure(fig, "05-xor-hidden-representation")

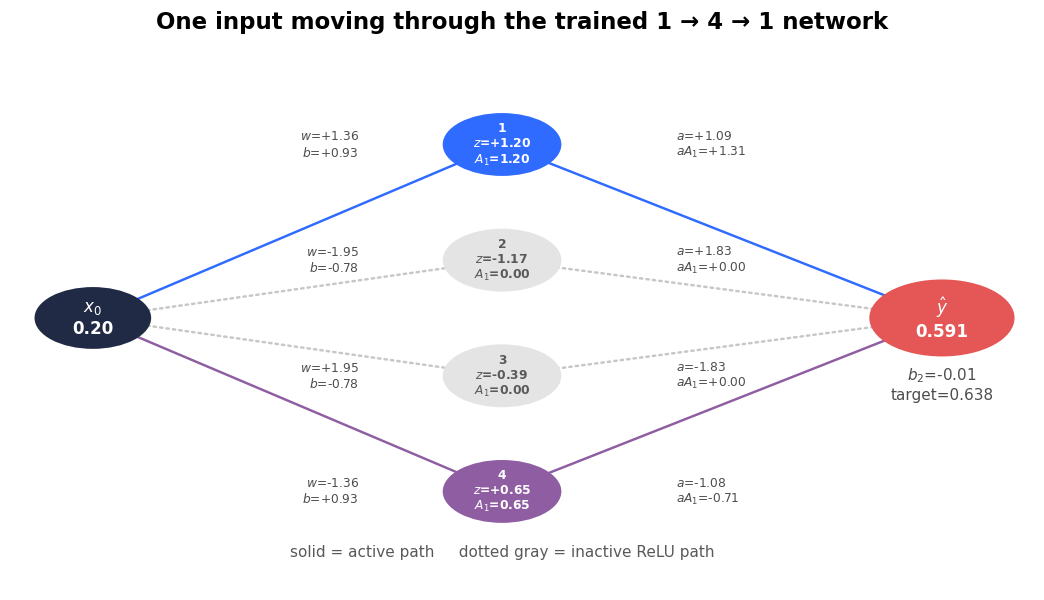
def plot_forward_pass_diagram(x0, W1, b1, Z1, A1, W2, contributions, b2, y_hat, target):
    fig, ax = plt.subplots(figsize=(12.0, 6.4))
    ax.set(xlim=(0, 1), ylim=(0, 1)); ax.axis("off")
    input_xy, output_xy = (0.08, 0.50), (0.91, 0.50)
    hidden_y = np.linspace(0.82, 0.18, A1.shape[1])
    hidden_xy = [(0.48, float(y_pos)) for y_pos in hidden_y]
    active = A1[0] > 0
    for j, xy in enumerate(hidden_xy):
        path_color = HINGE_COLORS[j] if active[j] else "0.78"
        path_style = "-" if active[j] else ":"
        ax.add_patch(FancyArrowPatch(input_xy, xy, arrowstyle="->", mutation_scale=12,
                                     lw=1.6, ls=path_style, color=path_color, zorder=0))
        ax.add_patch(FancyArrowPatch(xy, output_xy, arrowstyle="->", mutation_scale=12,
                                     lw=1.6, ls=path_style, color=path_color, zorder=0))
    ax.add_patch(Circle(input_xy, 0.057, fc=TARGET_COLOR, ec="none"))
    ax.text(*input_xy, f"$x_0$\n{x0:.2f}", color="white", ha="center", va="center",
            fontsize=11, fontweight="bold")
    for j, xy in enumerate(hidden_xy):
        face = HINGE_COLORS[j] if active[j] else "#E4E4E4"
        text_color = "white" if active[j] else "0.35"
        ax.add_patch(Circle(xy, 0.058, fc=face, ec="none"))
        ax.text(*xy, f"{j + 1}\n$z$={Z1[0,j]:+.2f}\n$A_1$={A1[0,j]:.2f}",
                color=text_color, ha="center", va="center", fontsize=8, fontweight="bold")
        ax.text(0.34, xy[1], f"$w$={W1[j,0]:+.2f}\n$b$={b1[j]:+.2f}",
                ha="right", va="center", fontsize=8, color="0.30")
        displayed_contribution = 0.0 if abs(contributions[0,j]) < 0.005 else contributions[0,j]
        ax.text(0.65, xy[1], f"$a$={W2[0,j]:+.2f}\n$aA_1$={displayed_contribution:+.2f}",
                ha="left", va="center", fontsize=8, color="0.30")
    ax.add_patch(Circle(output_xy, 0.071, fc=MODEL_COLOR, ec="none"))
    ax.text(*output_xy, f"$\\hat y$\n{y_hat:.3f}", color="white", ha="center", va="center",
            fontsize=11, fontweight="bold")
    ax.text(0.91, 0.35, f"$b_2$={b2:+.2f}\ntarget={target:.3f}", ha="center", color="0.30")
    ax.text(0.48, 0.06, "solid = active path     dotted gray = inactive ReLU path",
            ha="center", color="0.35")
    ax.set_title("One input moving through the trained 1 → 4 → 1 network", fontsize=15, pad=12)
    finish_figure(fig, "06-forward-pass-values")

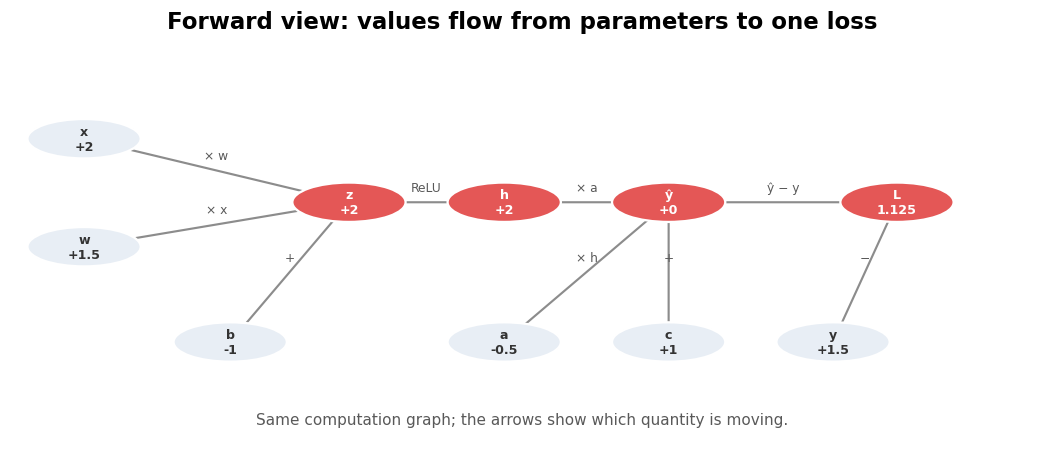
def plot_scalar_graph(values, view):
    fig, ax = plt.subplots(figsize=(12.0, 4.8))
    ax.set(xlim=(-0.06, 1.06), ylim=(-0.16, 1.12)); ax.axis("off")
    positions = {
        "x": (0.02, 0.82), "w": (0.02, 0.48), "b": (0.18, 0.18),
        "z": (0.31, 0.62), "h": (0.48, 0.62), "a": (0.48, 0.18),
        "yhat": (0.66, 0.62), "c": (0.66, 0.18), "y": (0.84, 0.18),
        "L": (0.91, 0.62),
    }
    edges = [("x", "z", "× w"), ("w", "z", "× x"), ("b", "z", "+"),
             ("z", "h", "ReLU"), ("h", "yhat", "× a"),
             ("a", "yhat", "× h"), ("c", "yhat", "+"),
             ("yhat", "L", "ŷ − y"), ("y", "L", "−")]
    if view == "forward":
        edge_color, title = "0.55", "Forward view: values flow from parameters to one loss"
        for source, target_name, label in edges:
            ax.add_patch(FancyArrowPatch(positions[source], positions[target_name], arrowstyle="->",
                                         mutation_scale=12, lw=1.4, color=edge_color, zorder=0))
            midpoint = np.mean([positions[source], positions[target_name]], axis=0)
            ax.text(midpoint[0], midpoint[1] + 0.035, label, fontsize=8, color="0.35", ha="center")
        labels = {name: f"{name}\n{values[name]:+.3g}" for name in positions}
        labels["yhat"] = f"ŷ\n{values['yhat']:+.3g}"
        labels["L"] = f"L\n{values['L']:.4g}"
        stem = "07-scalar-graph-forward"
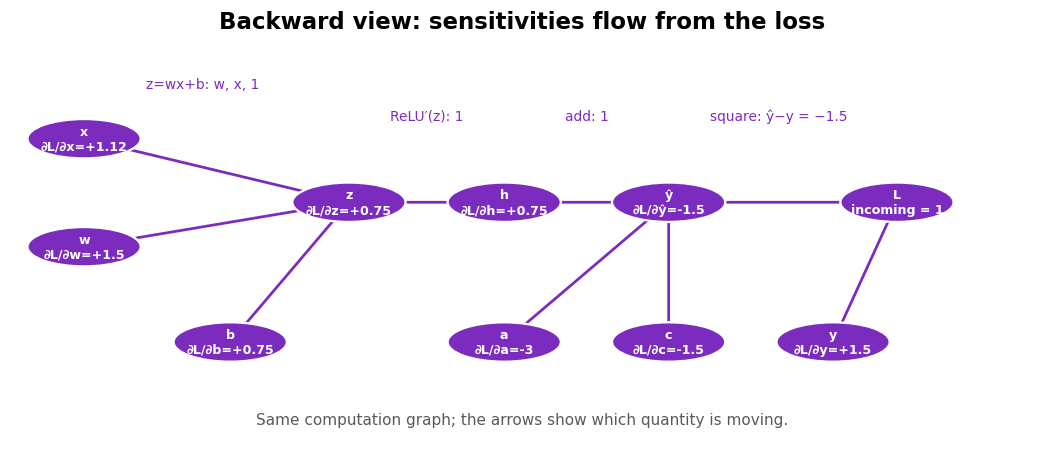
    else:
        edge_color, title = "#7B2CBF", "Backward view: sensitivities flow from the loss"
        for source, target_name, label in edges:
            ax.add_patch(FancyArrowPatch(positions[target_name], positions[source], arrowstyle="->",
                                         mutation_scale=12, lw=1.8, color=edge_color, zorder=0))
        labels = {name: f"{name}\n∂L/∂{name}={values['grads'][name]:+.3g}" for name in positions}
        labels["yhat"] = f"ŷ\n∂L/∂ŷ={values['grads']['yhat']:+.3g}"
        labels["L"] = "L\nincoming = 1"
        local = [(0.78, 0.88, "square: ŷ−y = −1.5"), (0.57, 0.88, "add: 1"),
                 (0.395, 0.88, "ReLU′(z): 1"), (0.15, 0.98, "z=wx+b: w, x, 1")]
        for px, py, text_value in local:
            ax.text(px, py, text_value, ha="center", fontsize=9, color=edge_color)
        stem = "08-scalar-graph-backward"
    for name, (px, py) in positions.items():
        face = edge_color if view == "backward" else (MODEL_COLOR if name in {"z", "h", "yhat", "L"} else "#E8EEF5")
        text_color = "white" if face in {"#7B2CBF", MODEL_COLOR} else "0.20"
        ax.add_patch(Circle((px, py), 0.062, fc=face, ec="white", lw=1.5, zorder=2))
        ax.text(px, py, labels[name], ha="center", va="center", color=text_color,
                fontsize=8.3, fontweight="bold", zorder=3)
    ax.set_title(title, fontsize=15, pad=10)
    ax.text(0.5, -0.08, "Same computation graph; the arrows show which quantity is moving.",
            ha="center", color="0.35")
    finish_figure(fig, stem)

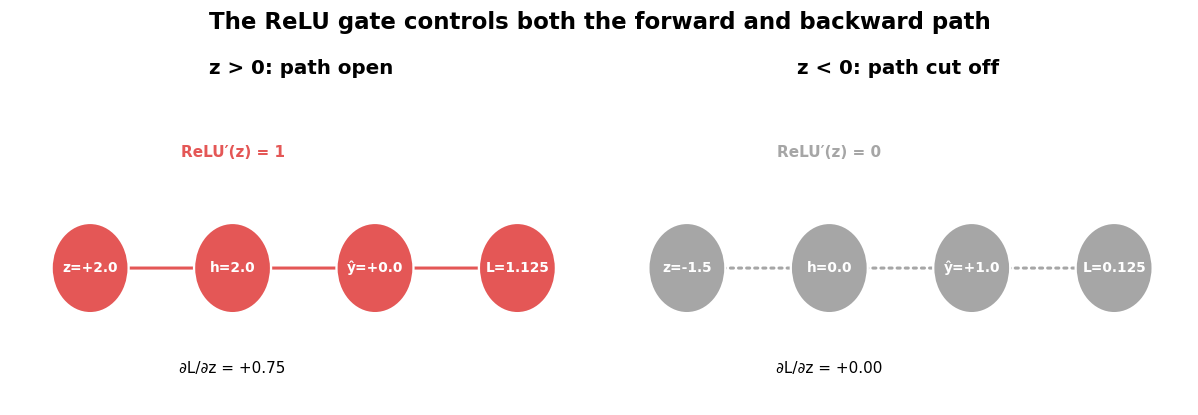
def plot_relu_cutoff(active_values, inactive_values):
    fig, axes = plt.subplots(1, 2, figsize=(11.0, 3.8), sharey=True)
    for ax, values, active in zip(axes, [active_values, inactive_values], [True, False]):
        ax.set(xlim=(-0.05, 1.05), ylim=(-0.22, 0.30)); ax.axis("off")
        points = [(0.10, 0), (0.37, 0), (0.64, 0), (0.91, 0)]
        names = [f"z={values['z']:+.1f}", f"h={values['h']:.1f}",
                 f"ŷ={values['yhat']:+.1f}", f"L={values['L']:.3f}"]
        path_color, style = (MODEL_COLOR, "-") if active else ("0.65", ":")
        for left, right in zip(points[:-1], points[1:]):
            ax.add_patch(FancyArrowPatch(left, right, arrowstyle="->", mutation_scale=13,
                                         color=path_color, ls=style, lw=2))
        for point, name in zip(points, names):
            ax.add_patch(Circle(point, 0.073, fc=path_color, ec="white", lw=1.5))
            ax.text(*point, name, ha="center", va="center", color="white",
                    fontsize=9, fontweight="bold")
        derivative = 1 if active else 0
        ax.text(0.37, 0.18, f"ReLU′(z) = {derivative}", ha="center",
                color=path_color, fontweight="bold")
        ax.text(0.37, -0.17, f"∂L/∂z = {values['grads']['z']:+.2f}", ha="center")
        ax.set_title("z > 0: path open" if active else "z < 0: path cut off", fontsize=13)
    fig.suptitle("The ReLU gate controls both the forward and backward path", fontsize=15, fontweight="bold")
    fig.tight_layout()
    finish_figure(fig, "09-relu-zero-gradient-path")

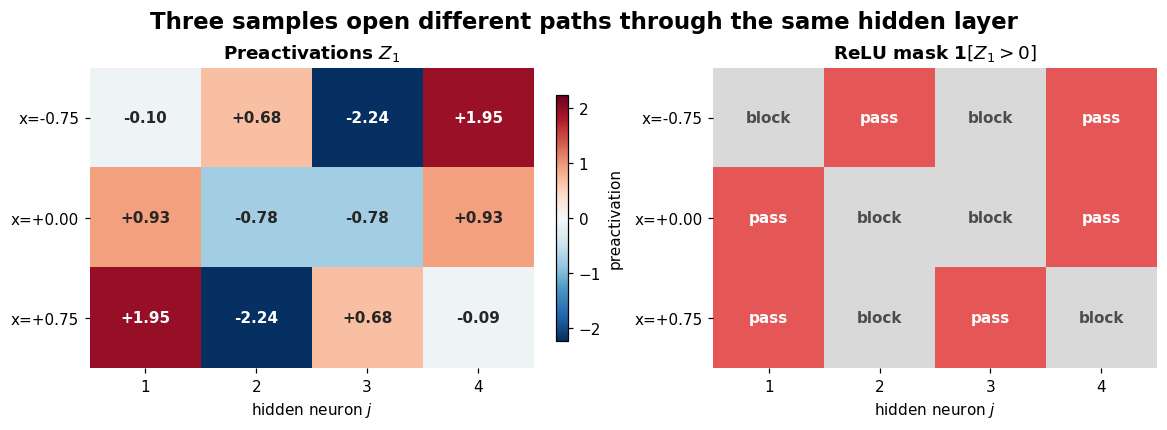
def plot_batch_relu_mask(X, Z1, mask):
    fig, axes = plt.subplots(1, 2, figsize=(10.5, 3.8), constrained_layout=True)
    z_max = float(np.abs(Z1).max())
    images = [
        axes[0].imshow(Z1, cmap="RdBu_r", vmin=-z_max, vmax=z_max, aspect="auto"),
        axes[1].imshow(mask, cmap=plt.matplotlib.colors.ListedColormap(["#D9D9D9", MODEL_COLOR]),
                       vmin=0, vmax=1, aspect="auto"),
    ]
    for row in range(Z1.shape[0]):
        for col in range(Z1.shape[1]):
            axes[0].text(col, row, f"{Z1[row, col]:+.2f}", ha="center", va="center",
                         color="white" if abs(Z1[row, col]) > 0.55 * z_max else "0.15", fontweight="bold")
            axes[1].text(col, row, "pass" if mask[row, col] else "block", ha="center", va="center",
                         color="white" if mask[row, col] else "0.30", fontweight="bold")
    labels = [f"x={value:+.2f}" for value in X[:, 0]]
    for ax, title in zip(axes, ["Preactivations $Z_1$", "ReLU mask $\mathbf{1}[Z_1>0]$"]):
        ax.set(title=title, xlabel="hidden neuron $j$", xticks=range(Z1.shape[1]),
               xticklabels=range(1, Z1.shape[1] + 1), yticks=range(Z1.shape[0]), yticklabels=labels)
        for spine in ax.spines.values(): spine.set_visible(False)
    fig.colorbar(images[0], ax=axes[0], shrink=0.82, label="preactivation")
    fig.suptitle("Three samples open different paths through the same hidden layer", fontsize=15, fontweight="bold")
    finish_figure(fig, "10-mini-batch-relu-mask")

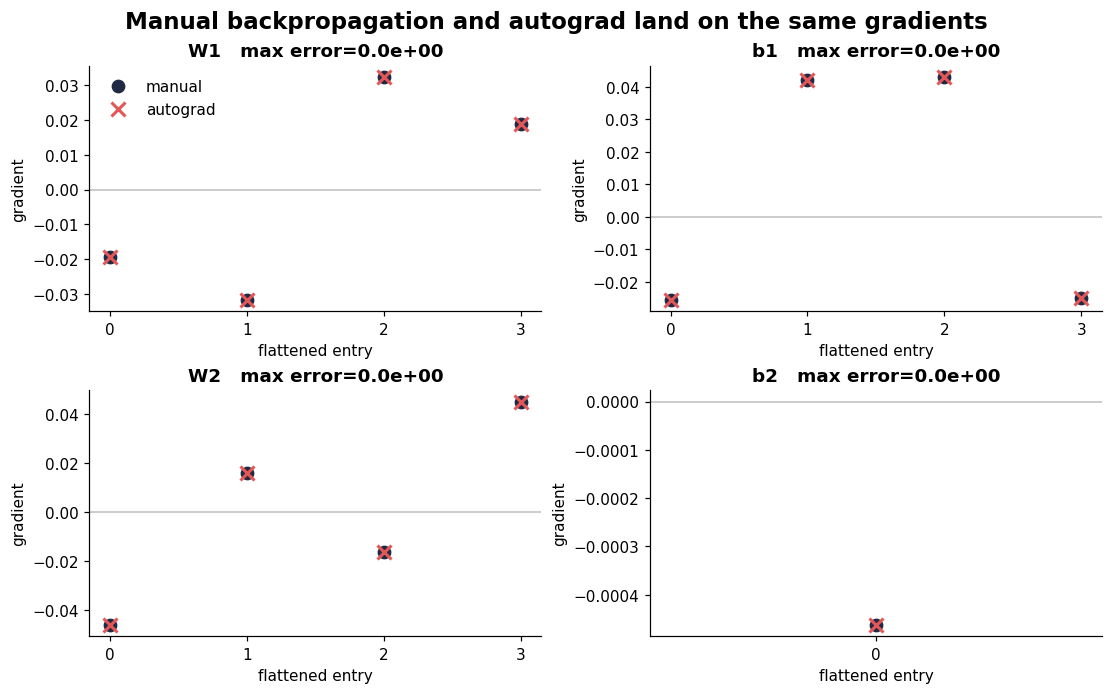
def plot_gradient_comparison(manual, automatic, errors):
    names = ["W1", "b1", "W2", "b2"]
    fig, axes = plt.subplots(2, 2, figsize=(10.0, 6.2), constrained_layout=True)
    for ax, name in zip(axes.flat, names):
        m = manual[name].reshape(-1).cpu().numpy()
        a = automatic[name].reshape(-1).cpu().numpy()
        indices = np.arange(len(m))
        ax.plot(indices, m, "o", ms=8, color=TARGET_COLOR, label="manual")
        ax.plot(indices, a, "x", ms=9, mew=2, color=MODEL_COLOR, label="autograd")
        ax.axhline(0, color="0.75", lw=1)
        ax.set(title=f"{name}   max error={errors[name]:.1e}", xlabel="flattened entry", ylabel="gradient")
        ax.set_xticks(indices)
    axes[0, 0].legend(frameon=False)
    fig.suptitle("Manual backpropagation and autograd land on the same gradients", fontsize=15, fontweight="bold")
    finish_figure(fig, "11-manual-versus-autograd")