One reading looks normal.
The recent history may tell another story.
Intro to ML · Two lectures + a practical lab

One reading looks normal.
The recent history may tell another story.
Intro to ML · Two lectures + a practical lab

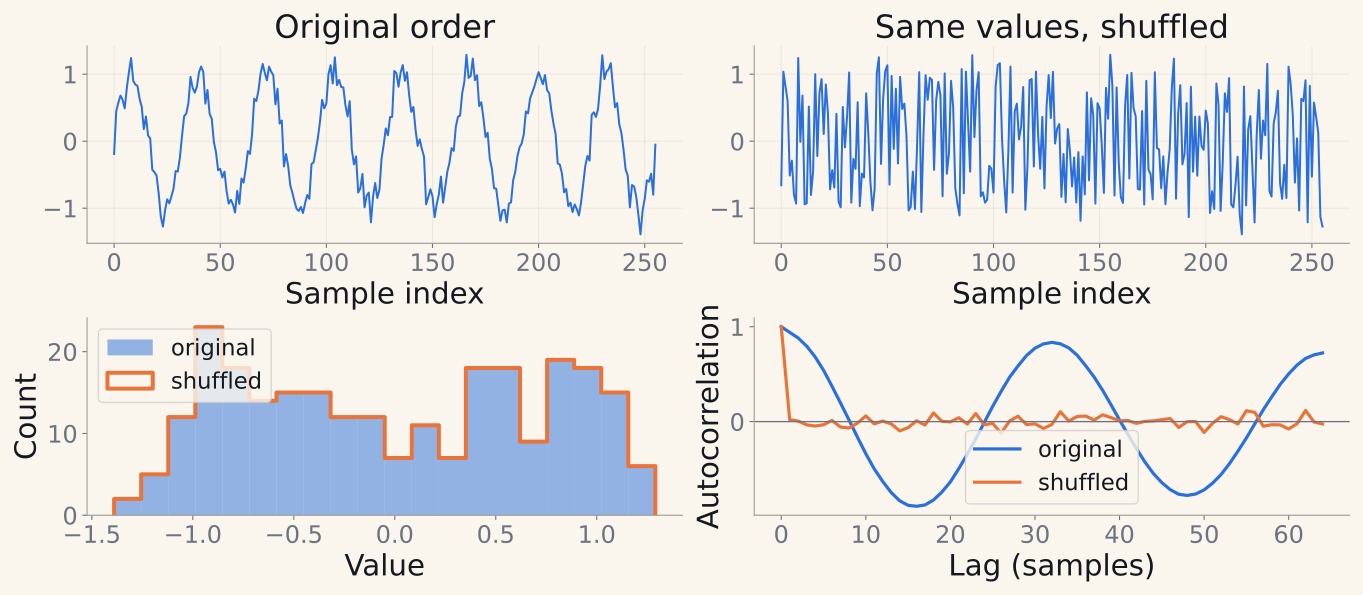
The order, spacing, and context of observations carry information.
IMU and joint currents
Is it moving normally?
What happens next?
EEG and heart activity
Which state or event produced this epoch?
Requests, latency, energy
Is this spike a fault, a daily pattern, or growth?
A water-circulation testbed links motor, hydraulic, thermal, and vibration summaries.
State detection: keep flagging the interval. Onset: mark when it begins.
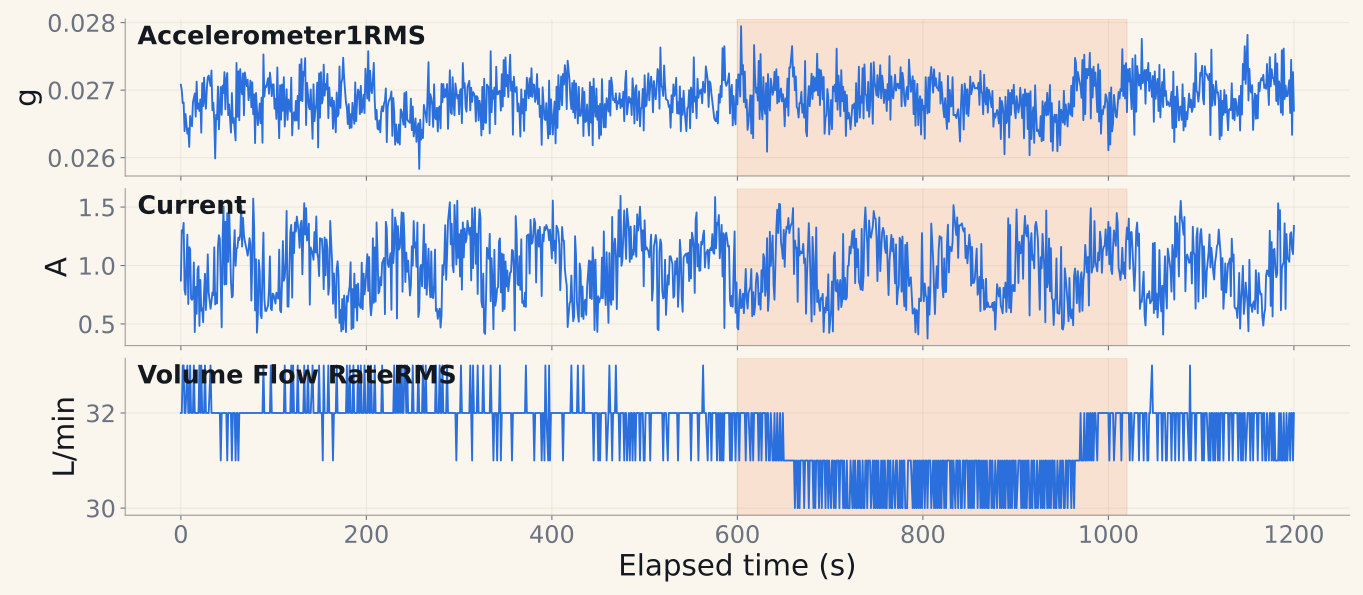
A row is a synchronized observation, not an independent example.
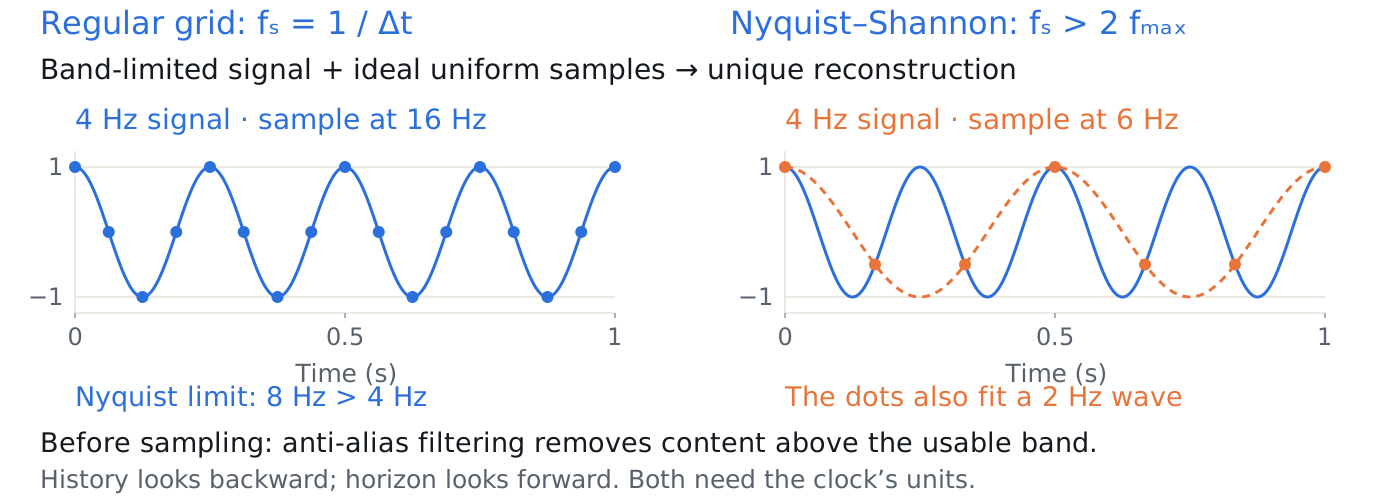
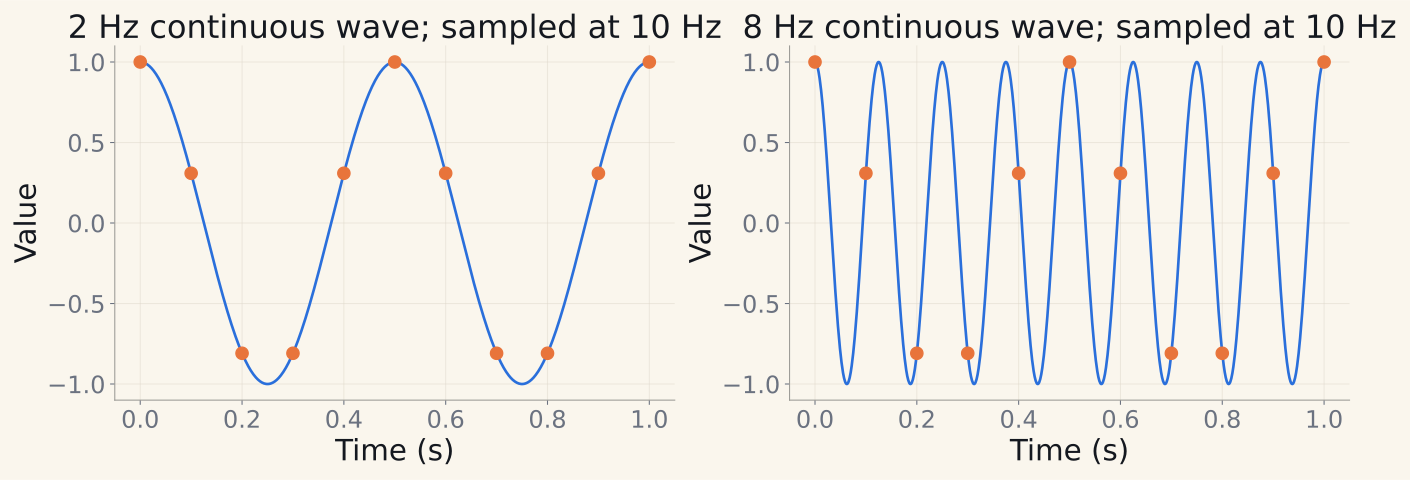
The clock sets units; the sampling rule sets which frequencies can be recovered.
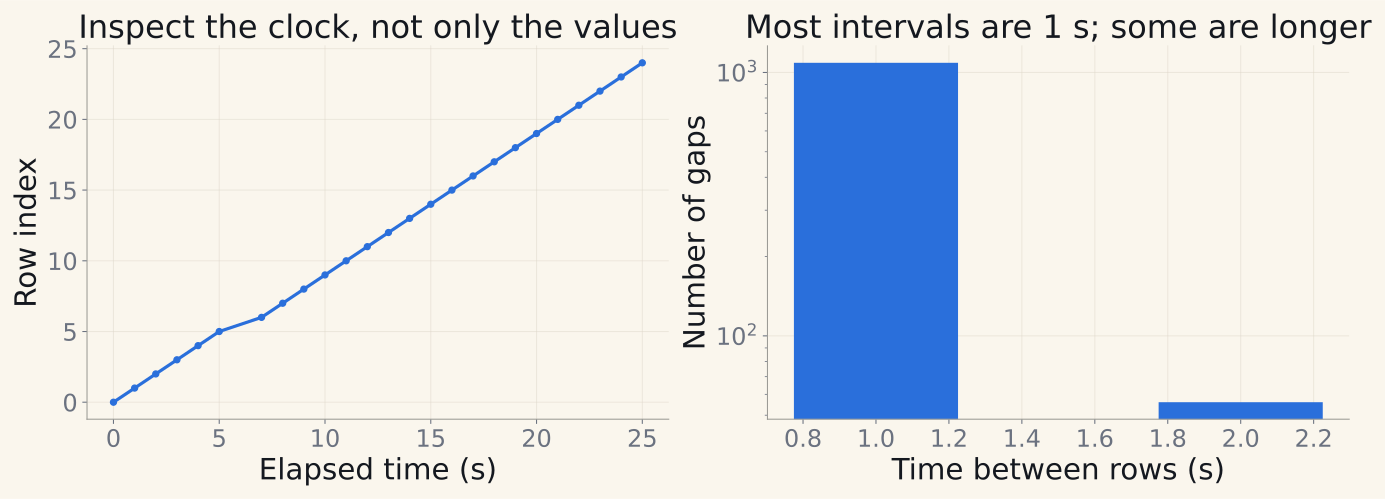
Regularize deliberately. Keep an observation mask; fill only by a declared causal rule.
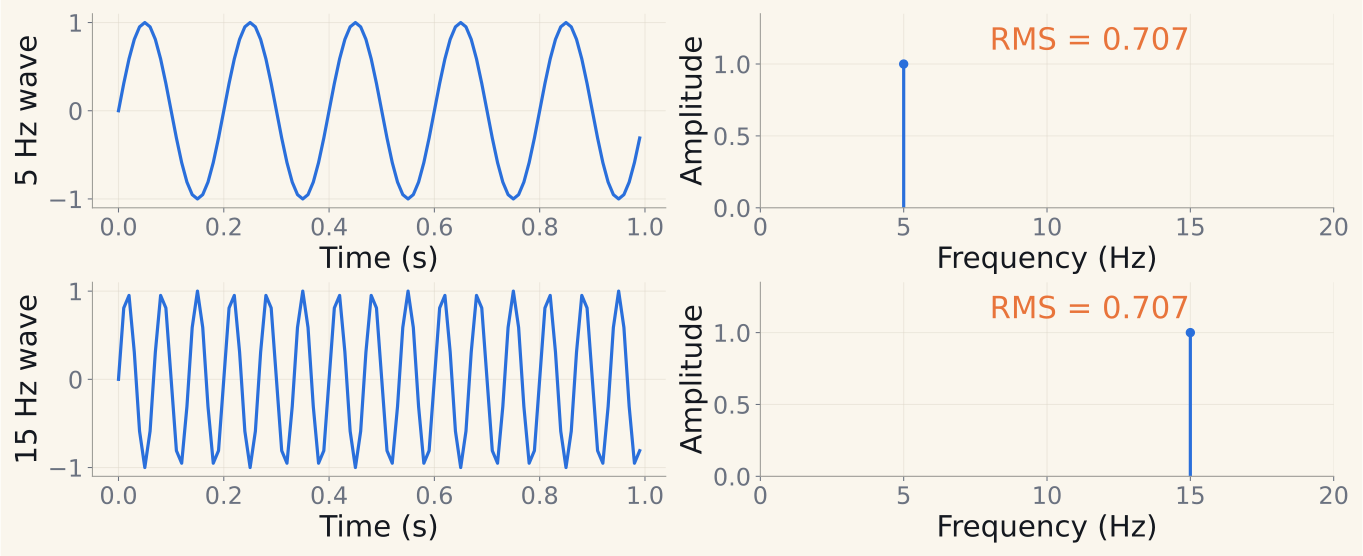
Same energy summary. Different oscillation frequencies. RMS cannot recover the original vibration spectrum.
For this teaching signal: x[t] = trend[t] + seasonal[t] + noise[t].
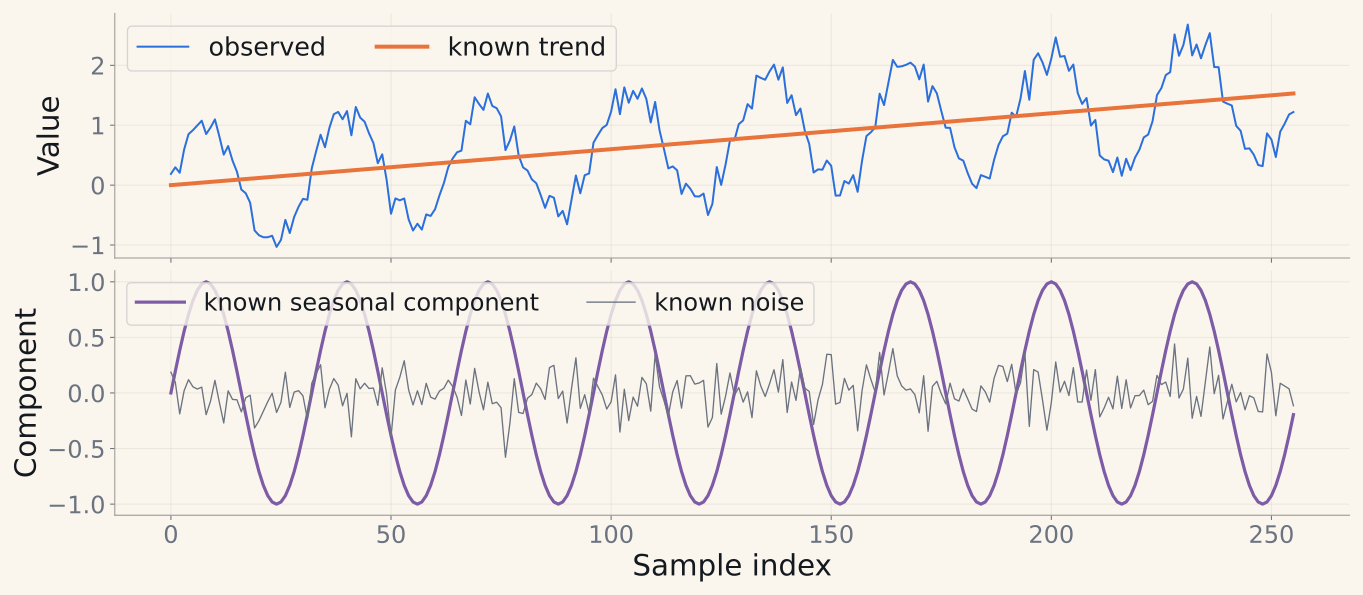
Focus: Treat stationarity as a modelling assumption that requires evidence.
Constant mean and finite variance
Autocovariance depends on lag, not absolute time
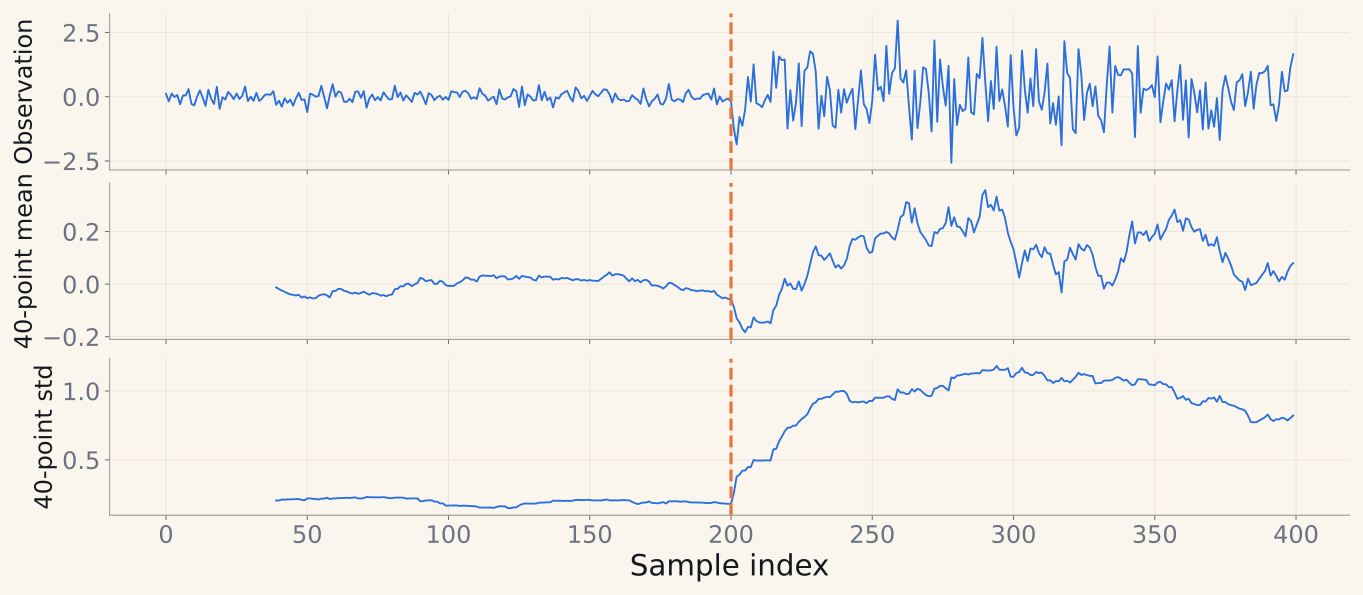
Compare local means and spreads
Inspect ACF, regimes, and residuals
A flat plot or one statistical test cannot establish every assumption.
| Property | Measure or plot | What it can reveal |
|---|---|---|
| Level / scale | Median, MAD, quantiles | Offsets, amplitude changes |
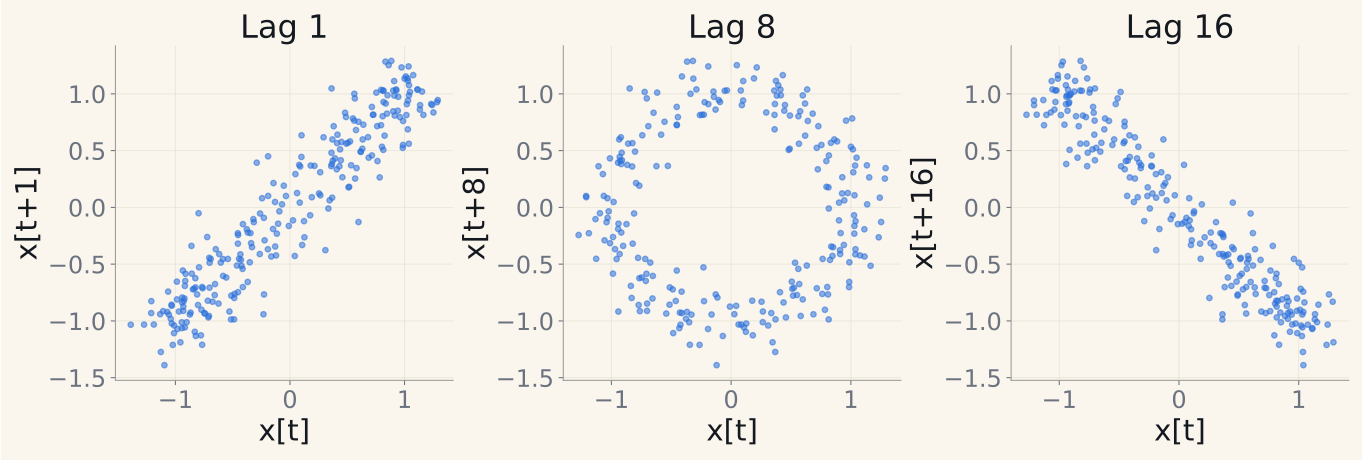
| Dependence | ACF, lag and channel plots | Memory, changed relationships |
| Observation quality | Gap lengths, masks, saturation | Sensor and logging failures |
| Local dynamics | Differences, local slope, spectrum | Transitions, oscillation changes |
A current value may be normal during startup and unusual at steady speed.
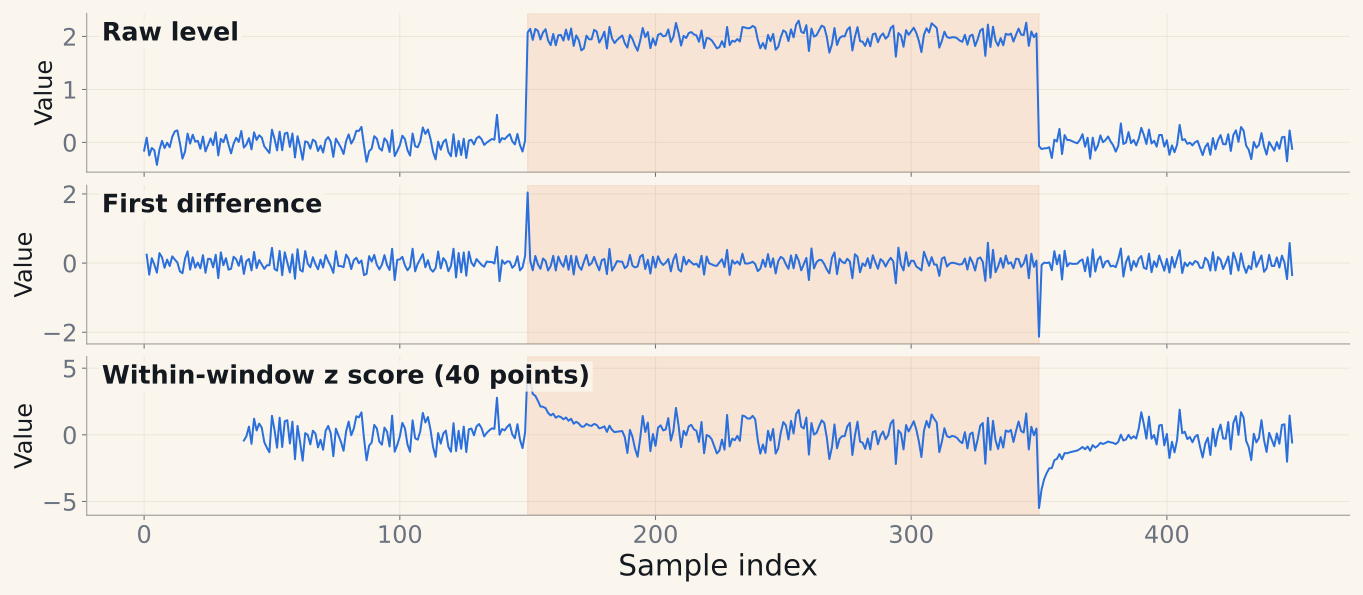
A new level may be a fault, a commanded change, or a new operating mode.
Labels and the monitoring goal give “unusual” its meaning.
What happened, and when?
Waveform, lags, local statistics
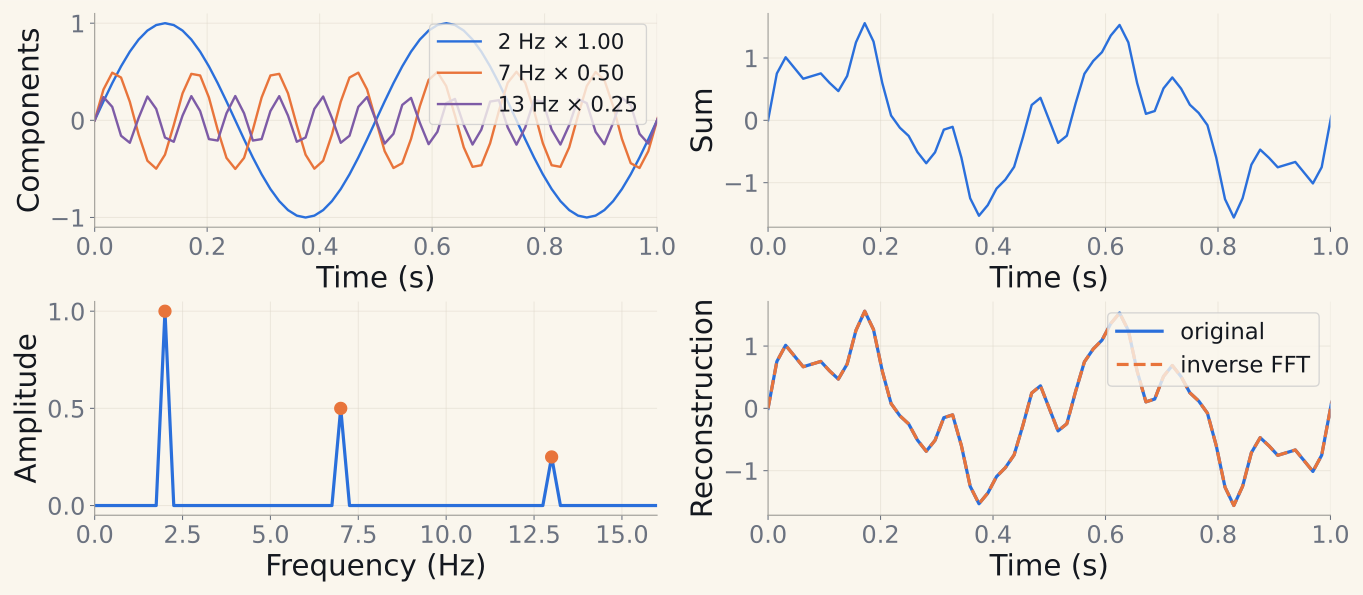
Which rhythms are present?
Fourier coefficients, magnitude, power
When did each rhythm appear?
STFT spectrogram, wavelet scalogram
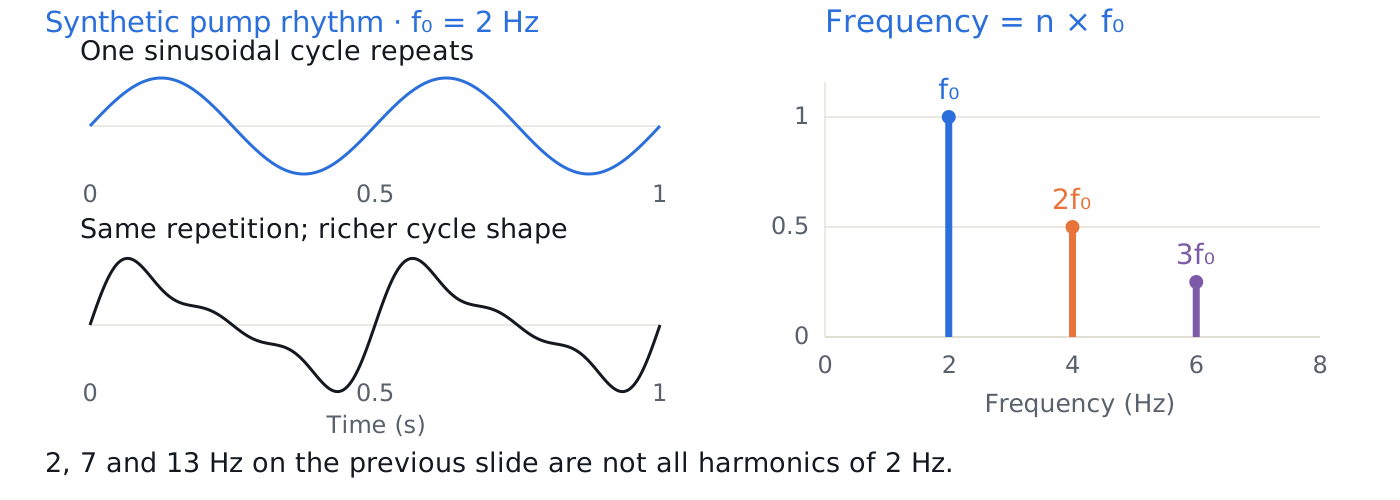
Harmonics are integer multiples of a fundamental: fₙ = n f₀.
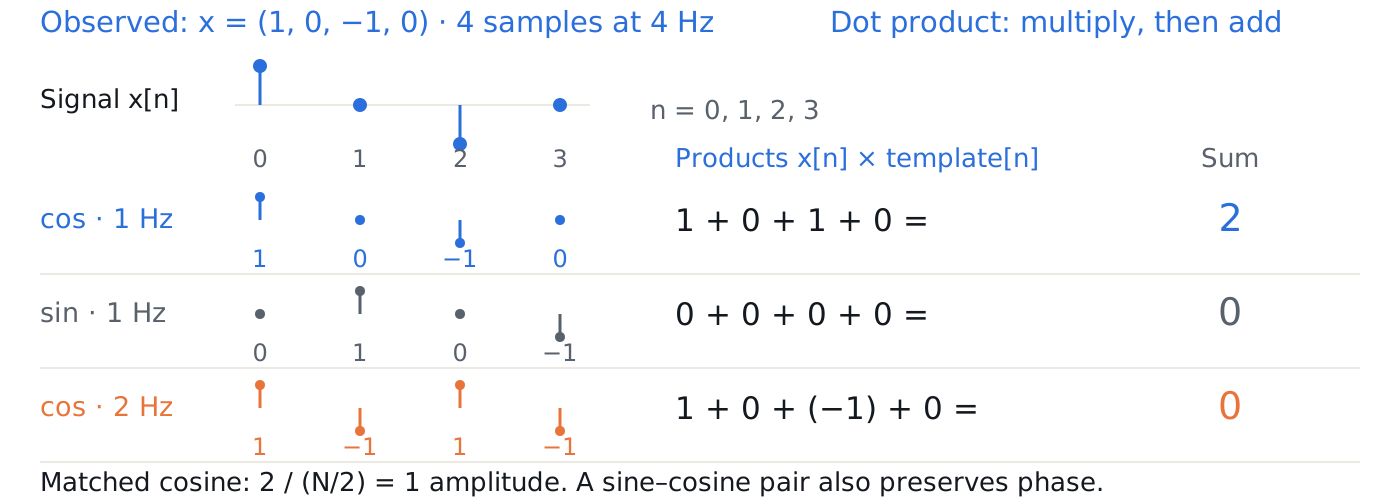
Multiply samples by a candidate wave, then add: matching structure survives the sum.
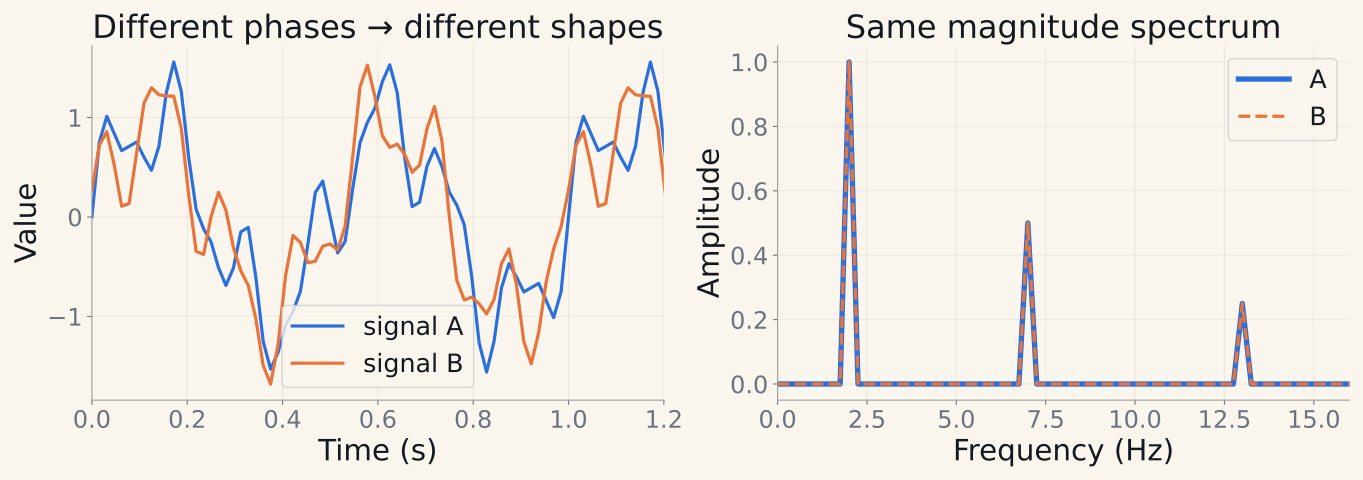
Full FFT coefficients ↔ original samples. Magnitude alone discards phase.
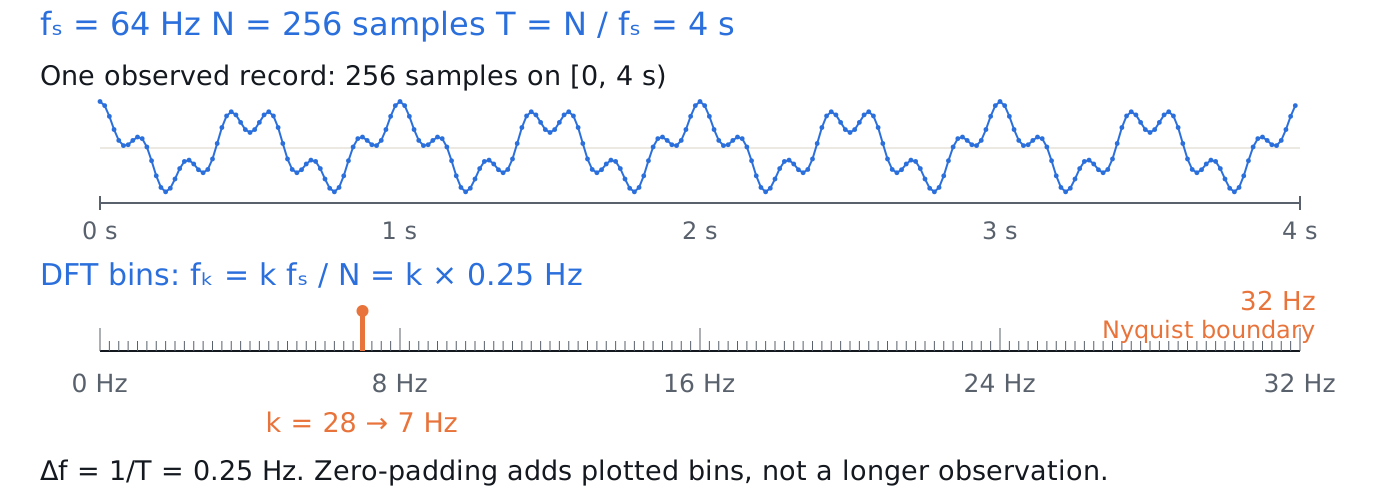
Bin spacing comes from observation duration; zero-padding only samples the spectrum more densely.
At 10 Hz sampling, these sample values are identical. Sampling faster can distinguish them.
A time reversal preserves FFT magnitudes. A spectrogram exposes the order of events.
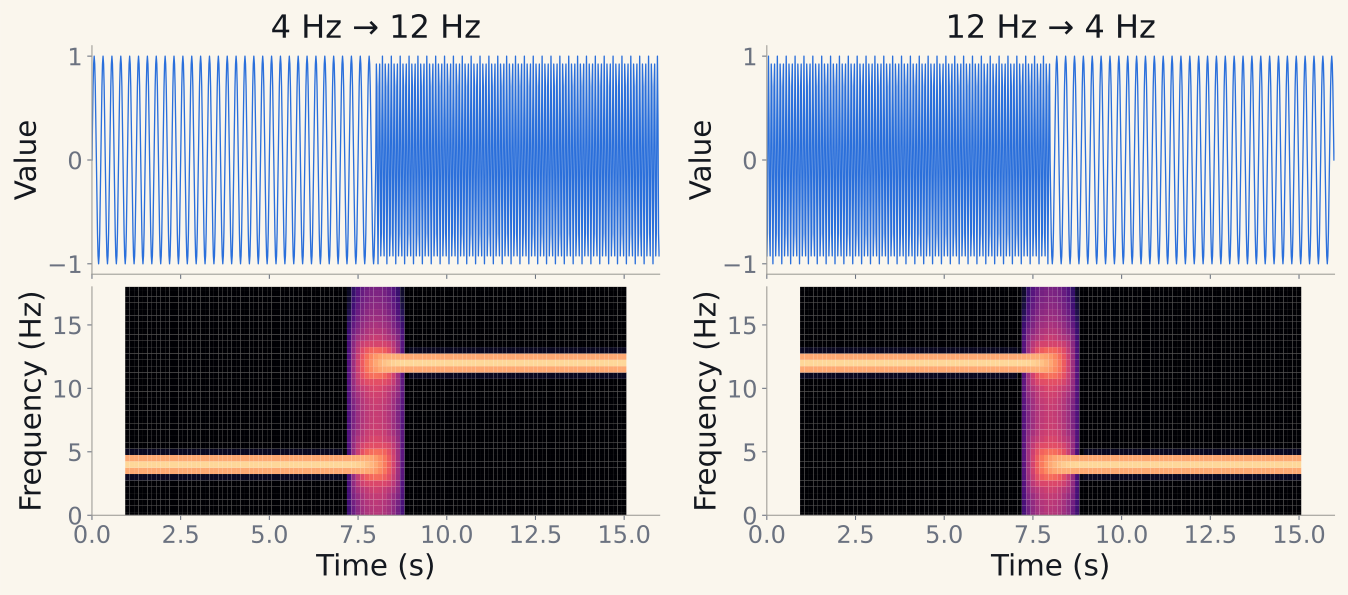
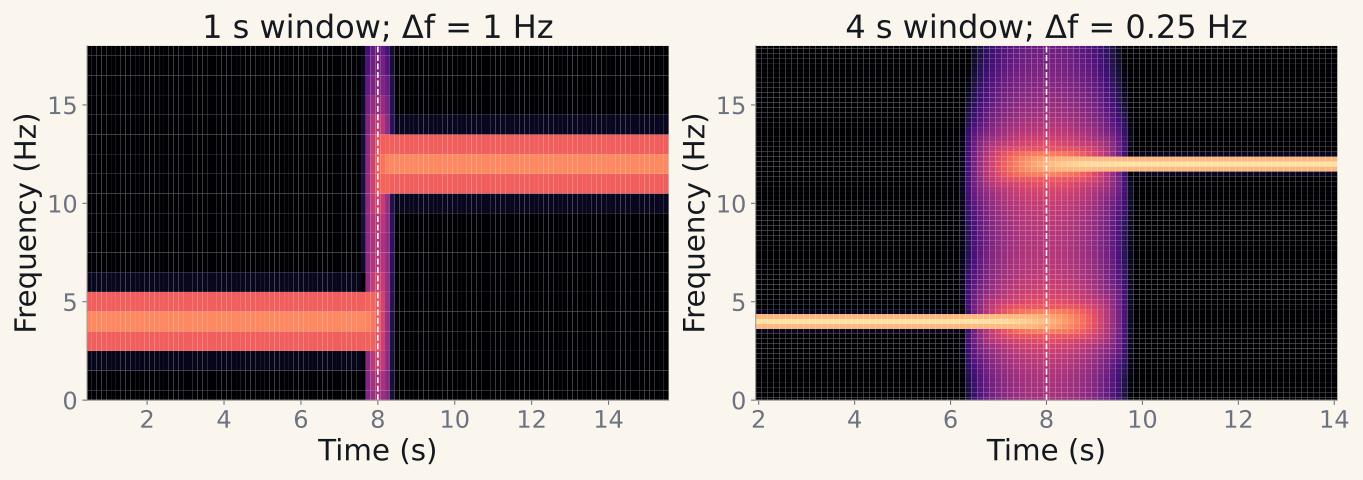
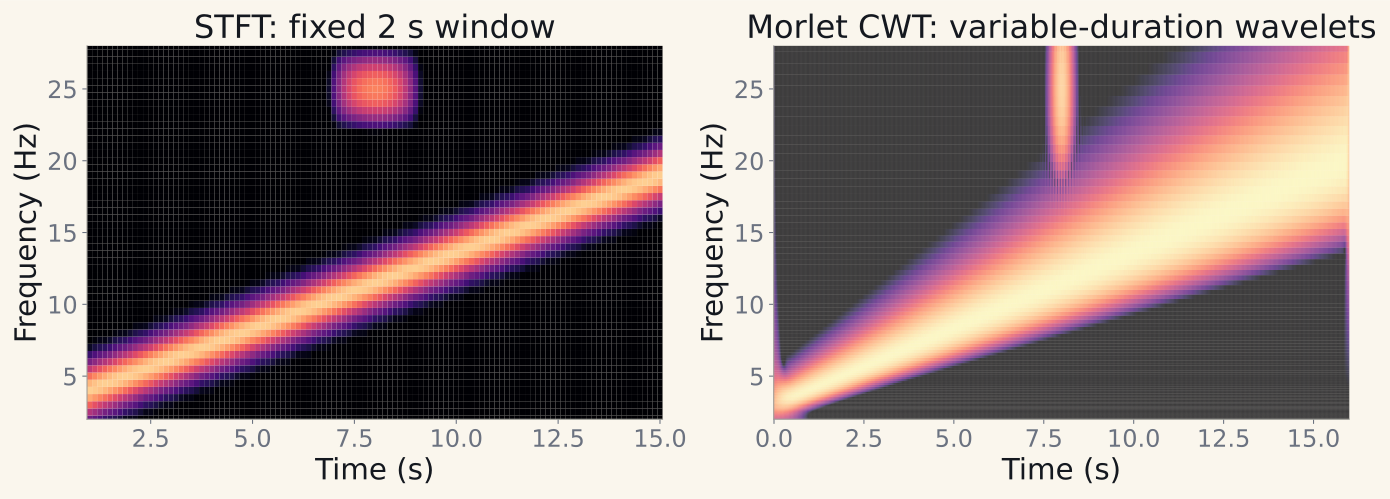
Short windows localize transitions. Long windows separate close frequencies.
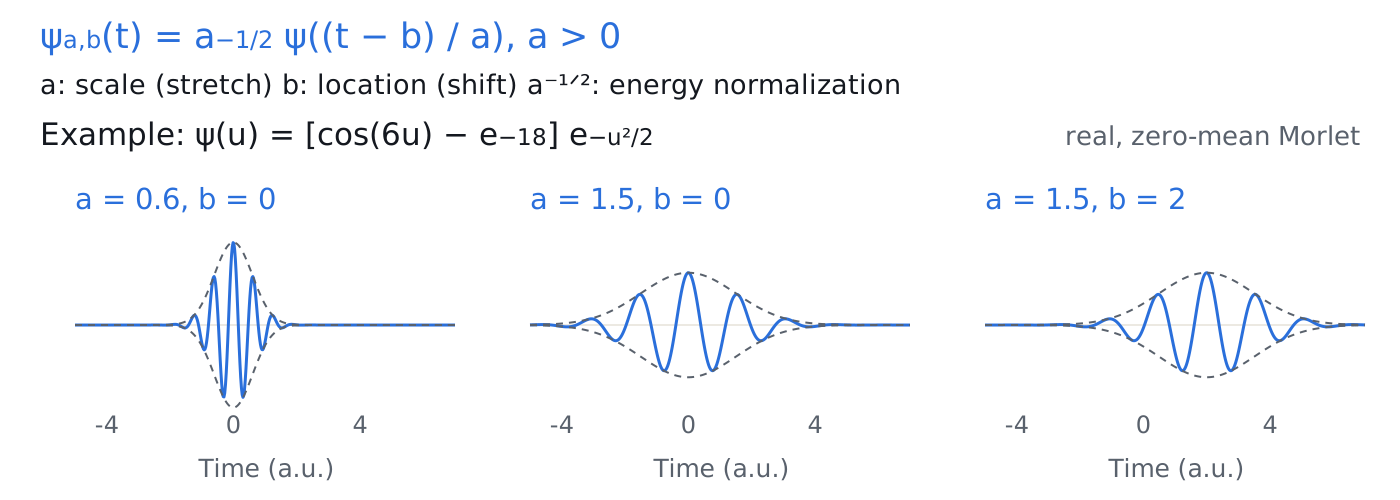
Scale changes duration and frequency; translation chooses where the probe looks.
Different probes emphasize different shapes; their mathematical constraints still matter.
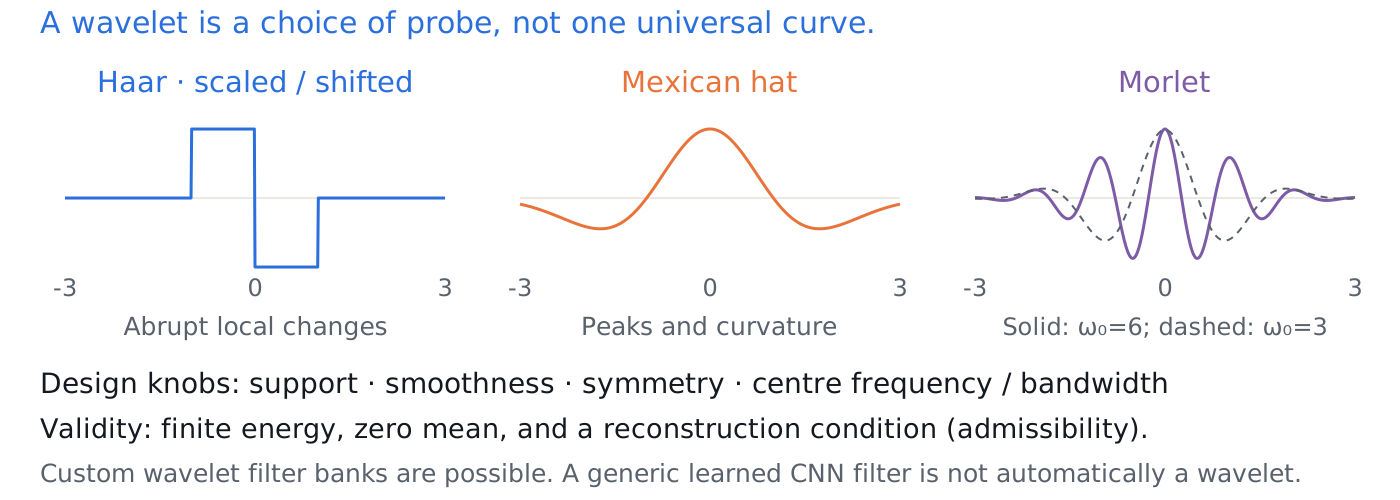
STFT uses one duration. CWT uses multiple scales. Choose the representation for the event.
For an anomaly decision after observing x[t], every feature must use times ≤ t.
| Decision time | x[t] | x[t−1] | x[t−2] | Optional target |
|---|---|---|---|---|
| 2 | 4 | 2 | 1 | x[3] = 3 |
| 3 | 3 | 4 | 2 | x[4] = 5 |
| 4 | 5 | 3 | 4 | not observed yet |
Lag features let a tabular model use order. The target determines the alignment.
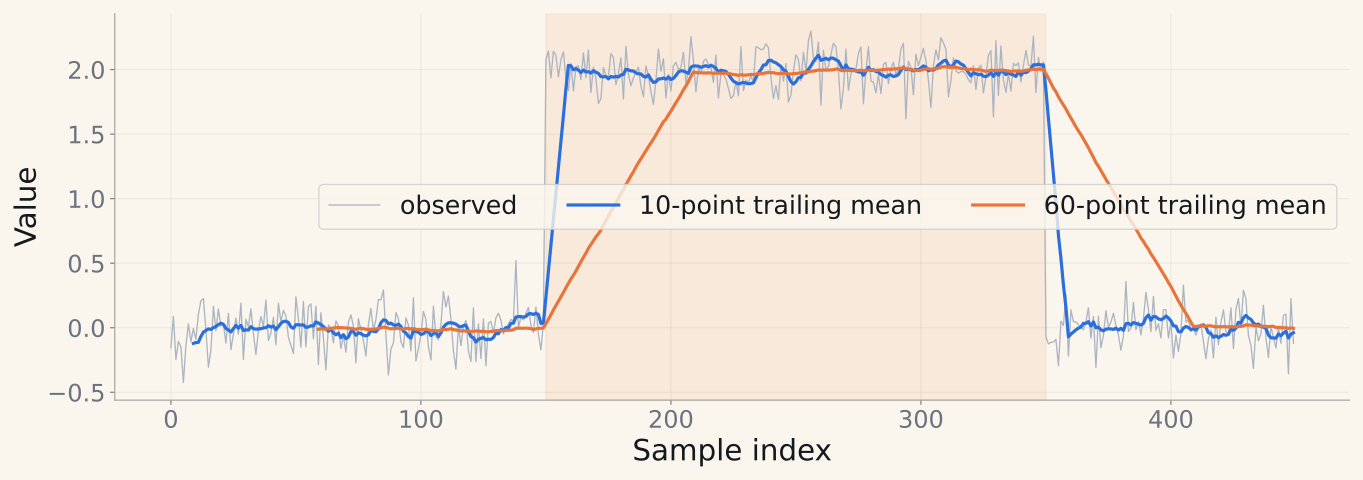
Trailing mean / EWMA: more stable estimates, slower transitions, possible adaptation to a fault.
| Family | Examples | Useful for | What it can hide |
|---|---|---|---|
| Level | Mean, median | Persistent offsets | Short transients |
| Spread | Std, MAD, IQR | Volatility, noisy states | Mean changes |
| Energy | RMS | Amplitude/energy summaries | Phase and waveform |
| Extremes | Min/max, quantiles | Spikes, tails, operating limits | Order inside the window |
| Dynamics | Difference, slope, ACF | Transitions and persistence | Absolute level |
A spectrum of SKAB RMS describes modulation of RMS — not the missing raw vibration spectrum.
Peak frequency and band power
Spectral centroid or entropy
Pick the bands and window from the domain.
Energy across selected scales
Transient coefficient peaks
State the wavelet, scale mapping, and edge policy.
Useful features: channel differences, rolling covariance, or distance from a learned normal subspace.
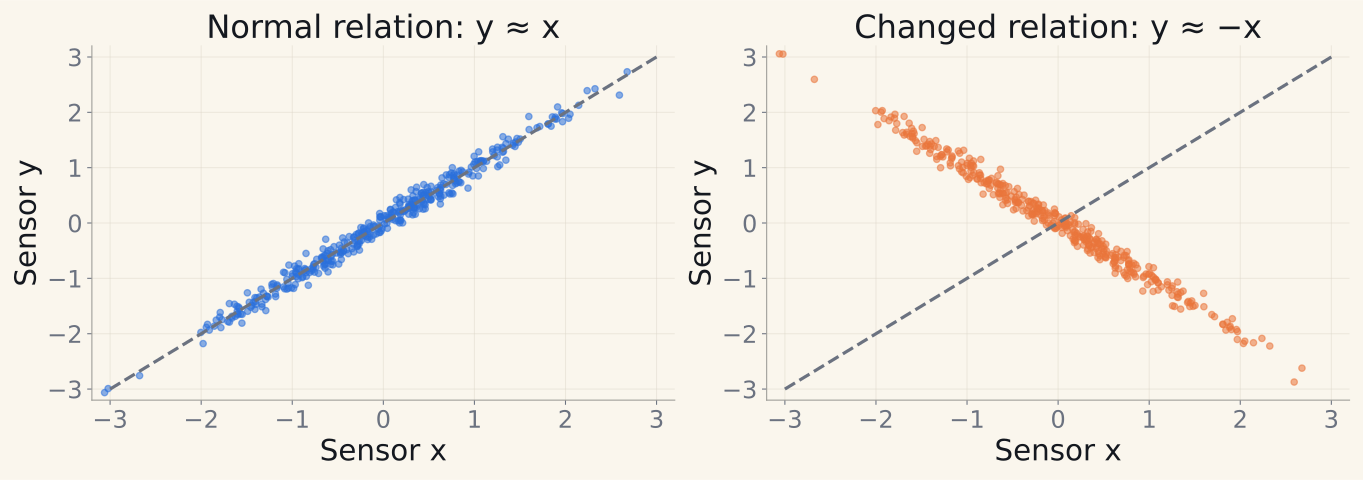
Choose invariances deliberately: per-window centering can erase the very fault we want to detect.
| Task | Output | Example |
|---|---|---|
| Classification | One label per window | Movement type from IMU / EEG epoch |
| Forecasting | Future values / distributions | Next-hour demand |
| Anomaly detection | Score, then abnormal-state decision | Pump monitoring |
| Segmentation | State label at each time | Walking → standing → sitting |
| Imputation | Values at missing positions | Lost telemetry blocks |
| Task | First comparison | Next step |
|---|---|---|
| Classification | Statistics + logistic regression | ROCKET / EEGNet |
| Forecasting | Last value / seasonal naïve | Lag regression / foundation model |
| Anomaly detection | Robust normal-state distance | PCA / Isolation Forest / score ensemble |
| Segmentation | Thresholds / HMM | Temporal CNN; change-point methods |
| Imputation | Last value / interpolation | Kalman model / learned imputation |
Causality depends on the decision time, not on the model’s name.
Use the error only after x[t] arrives.
A trailing statistic may include the current observation.
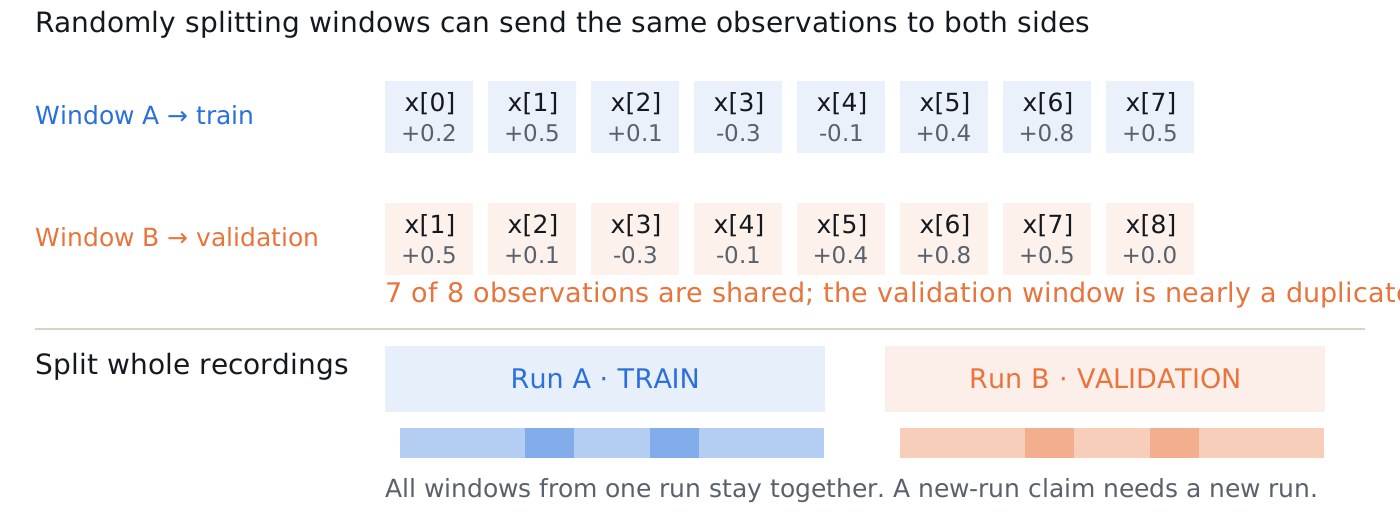
These length-eight windows share seven observations. A new-run evaluation holds out whole recordings.
Expanding windows retain all earlier data; rolling windows keep a fixed recent history.
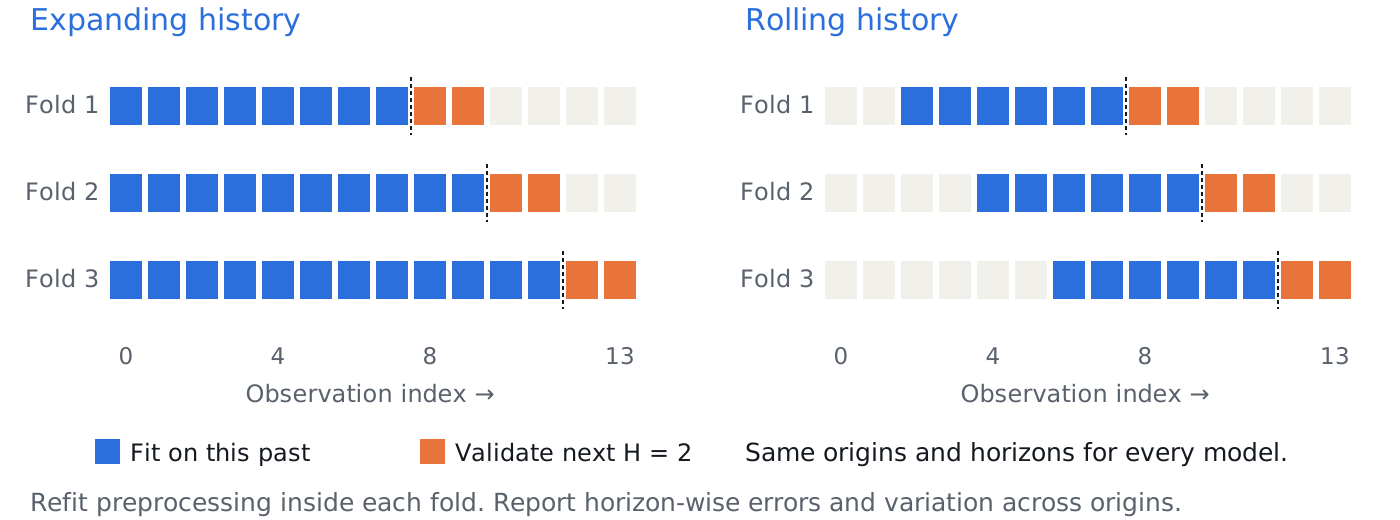
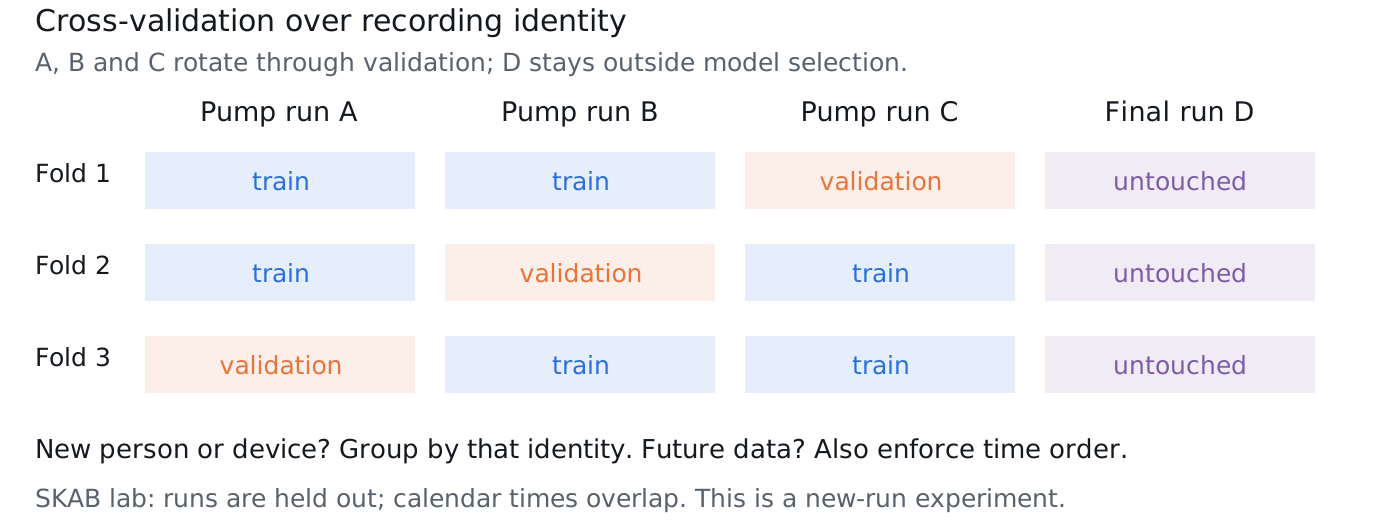
Time splits test the future; group splits test new runs, people or devices. Some deployments require both.
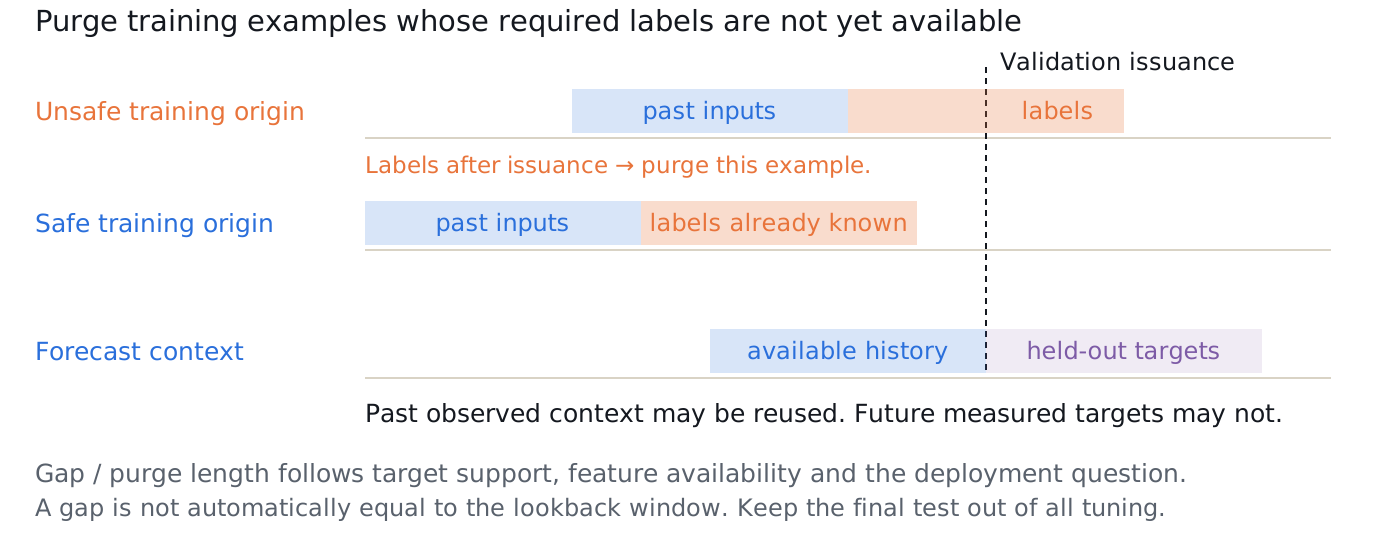
Choose the gap from what each training example needs to know; preserve legitimately available forecasting history.
Hyndman & Athanasopoulos: Forecasting: Principles and Practice
3Blue1Brown: Fourier transform intuition
PyWavelets: continuous wavelets, scale and frequency
Katser & Kozitsin: SKAB
Serega artwork reused from Albert Nasybullin’s Deep Learning for Search course.
Scientific control plots are computed; synthetic plots are labeled explicitly.
← / → or Space: next scene step, then next slide
Shift + ← / →: skip directly to another slide · Home / End: first / last
E: Lecture / Explore · R: restart the current scene or transfer check
O: overview · A: pen · C: clear · F: fullscreen
Transfer checks: choose, explain, then reveal. Right reveals reasoning after choosing and explaining. Shift+arrows skips slides.
Esc: close panel · #: slide number in the URL
Print / Save as PDF: slides plus selected scene keyframes. Annotations stay in this browser tab.